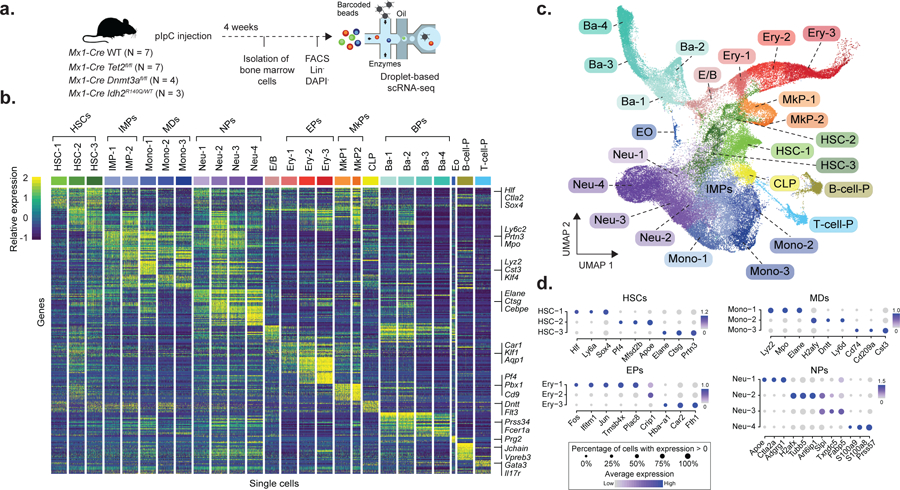
Figure 1. Experimental design and single cell RNA sequencing data integration and clustering.

a) Experimental design for scRNA-seq experiments, showing the number of mice used for each genotype (pIpC = polyinosinic-polycytadylic acid; FACS = Fluorescence-assisted cell sorting, Lin− = Lineage negative, DAPI− = negative for DAPI staining). b) Single cell expression profiles from 200 randomly sampled cells from each of the cell clusters from WT mice (HSC = Hematopoietic stem cell; IMP = Immature myeloid progenitor, Mono = Monocyte progenitor, Neu = Neutrophil/granulocyte progenitor; E/B = Erythroid/basophil progenitor; Ery = Erythroid progenitor; MkP = Megakaryocyte progenitor; CLP = Common lymphoid progenitor; Ba = Basophil progenitor; Eo = Eosinophil progenitor; B-cell-P = B-cell progenitor; T-cell-P = T-cell progenitor). Examples of genes used for classification are shown. c) Uniform Manifold Approximation and Projection (UMAP) dimensionality reduction (n = 68,613 cells) d) Top three differentially expressed genes (FDR < 0.05, logistic regression with Bonferroni correction) when comparing each cell cluster with the remaining clusters corresponding to the same cell type in WT (N = 4 mice from Chromium technology). HSCs = Hematopoietic stem cells (n = 1,164 cells); MDs = Monocytic-dendritic progenitor, (n = 917 cells); EPs = Erythroid progenitors (n = 1,169 cells); NPs = Neutrophil progenitors (n = 2,421 cells). The dot size encodes the fraction of cells within the cluster that show detectable expression of the gene (UMIs > 0), while the color encodes the average expression level across all cells within a cluster.
