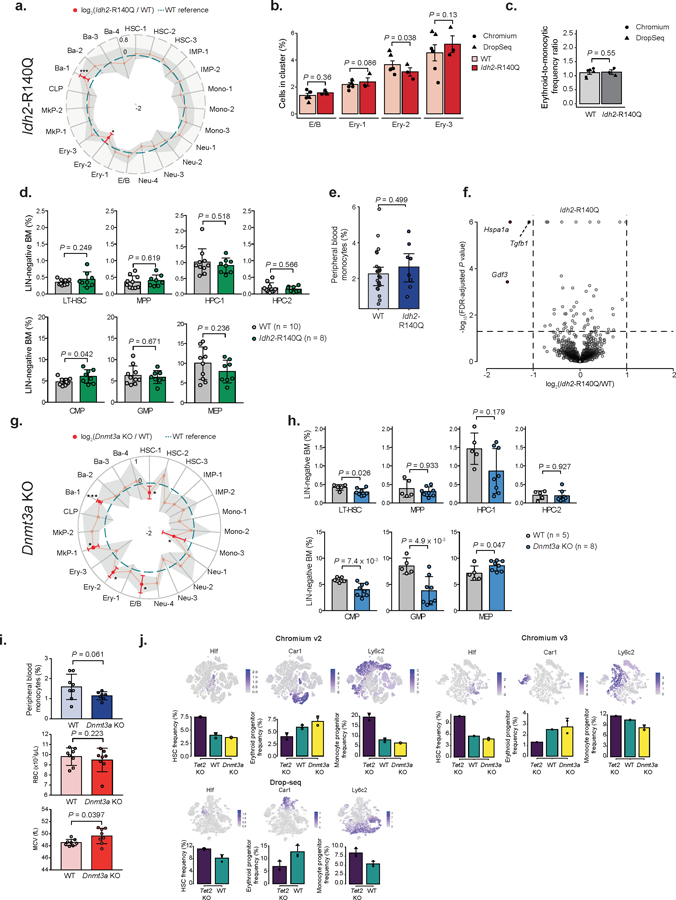
Extended Data Fig. 6. Validation of cell cluster frequency changes in Idh2-R140Q mutant mice and Dnmt3a KO mice.

a) Frequency changes for Lin− Idh2-R140Q (n = 3) relative to WT (n = 6) mice 4 weeks post-recombination (linear mixed model (LMM) followed by ANOVA; *P < 0.05; ***P < 0.01). b) E/B and Ery 1–3 frequencies 4 weeks after recombination for WT (n = 6) and Idh2-R140Q (n = 3) mice. Error bars represent standard error of the mean (SEM; LMM followed by ANOVA). c) Ratio between erythroid (E/B, Ery-1 and ERy-2) and monocytic (IMP-1 and Mono-1) clusters for WT (n = 6) and Idh2-R140Q (n = 3) mice 4 weeks post-recombination. Error bars indicate SEM (LMM followed by ANOVA). d) Flow cytometry of hematopoietic progenitors from WT (n = 10) and Idh2-R140Q (n = 8) mice 4 weeks post-recombination (two-sided Students t-test; LT-HSC = long-term hematopoietic stem cell; MPP = Multi-potent progenitor; HPC = Hematopoietic progenitor cell; CMP = common myeloid progenitor; GMP = Granulocyte-monocyte progenitor; MEP = megakaryocyte-erythrocyte progenitor). e) Peripheral blood monocytes for WT (n = 22) or Idh2-R140Q (n = 8) mice 4 weeks post-recombination (two-sided Students t-test). f) Differential gene expression between WT (n = 2,150 cells) and Idh2-R140Q (n = 1,184 cells) HSC 1–3 clusters. Red dots represent differentially expressed genes (permutation test followed by Benjamini-Hochberg (BH) correction, P < 0.05 and absolute log2 fold change > 1). g) Frequencies for Lin− Dnmt3a KO (n = 4) relative to WT (n = 4) mice, 4 weeks post-recombination (LMM followed by ANOVA; *P < 0.05; ***P < 0.001). h) Flow cytometry of WT (n = 5) and Dnmt3a KO (n = 8) mice 4 weeks post-recombination (two-sided Students t-test). i) Peripheral blood measurements for WT (n = 8) or Dnmt3a KO (n = 8) mice 4 weeks post-recombination (two-sided Students t-test; RBC = red blood cell; MCV = mean corpuscular volume). j) Frequency changes in HSCs (Hlf+), erythroid (Car1+) and monocyte (Ly6c2+; Irf8+) progenitors for WT (n = 6), Tet2 KO (n = 6) and Dnmt3a KO (n = 4) mice clustered independently for each technology. For bar plots, bars represent mean values, dots represent mouse replicates and error bars represent standard deviation unless indicated otherwise. For radar plots, red dots indicate significant frequency changes; red error bars represent standard deviation; dashed line indicates WT reference frequencies and shadow region indicates +/− standard deviation.
