
Extended Data Fig. 7. Gene module analysis.
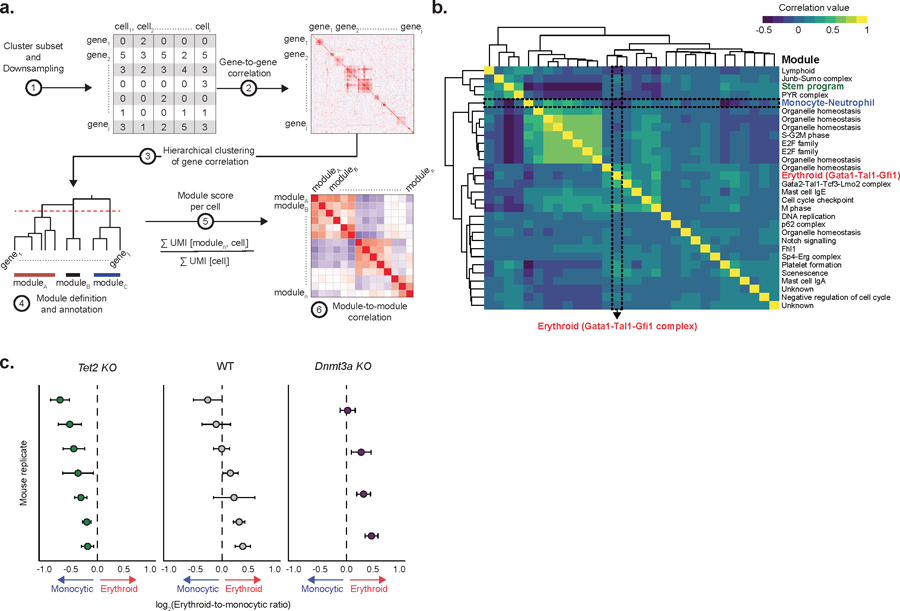
a) Schematic representation of the process for gene module identification. b) Correlation between gene module scores in HSC clusters (HSC 1–3), as calculated by the number of unique molecular identifiers (UMIs) mapping to the genes from each module per 10,000 total UMIs in the cell (Pearson correlation). c) Transcriptional priming values per biological replicate for Tet2 KO (n = 2,989 cells; n = 7 mice), WT (n = 2,150 cells; n = 7 mice) and Dnmt3a KO (n = 1,325 cells; n = 4 mice). Dots represent the mean value; error bars show the 95% confidence interval.