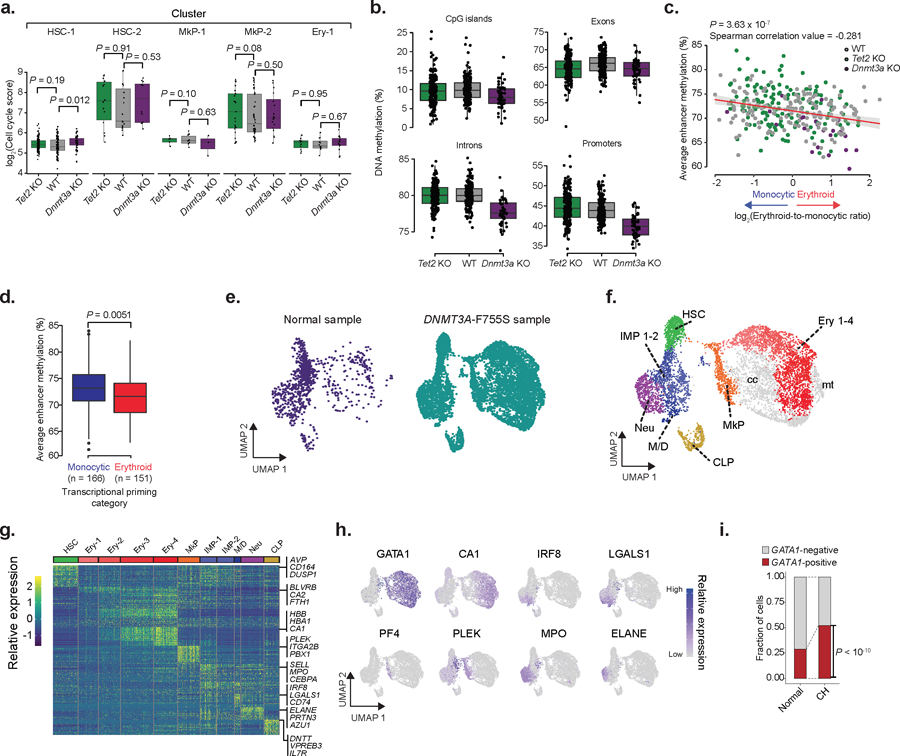
Extended Data Fig. 10. Single cell RNA and methylation reveals increased heterogeneity and links enhancer methylation with transcriptional priming.

a) LT-HSCs cell cycle scores for WT (n = 178 cells), Tet2 KO (n = 182 cells) and Dnmt3a KO (N =50 cells) as calculated by the number of UMIs mapping to the gene set per 10,000 total UMIs for each of the mapped clusters (two-sided Wilcoxon rank sum test). b) Single cell methylation percentage of CpG islands (CpGi), exon, intron and promoter regions for WT (n = 178 cells), Tet2 KO (n = 182 cells) or Dnmt3a KO (n = 50 cells) LT-HSCs. CpGi were robust to Tet2 deletion-induced hypermethylation, as previously reported69,70. c) Correlation between erythroid-to-monocytic transcriptional priming and mean enhancer methylation in WT (n = 178), Tet2 KO (n = 182) and Dnmt3a KO (n = 50) LT-HSCs (Spearman correlation; two-sided Students t-test). d) Average single cell enhancer methylation comparison between erythroid (n = 151 cells) or monocytic (n = 166 cells) primed LT-HSCs across genotypes (two-sided Wilcoxon rank sum test). e) CD34+ hematopoietic bone marrow progenitors from normal7 (n = 1,035 cells) or DNMT3A-F755S mutant affected (n = 7,338 cells) subjects. f) Clusters for the clonal hematopoiesis sample (HSC = hematopoietic stem cell; IMP = immature myeloid progenitor; Neu = neutrophil/granulocyte progenitor; Ery = erythroid progenitor; M/D = monocyte-dendritic progenitor; CLP = common lymphoid progenitor; MkP = megakaryocyte progenitor; cc = high cell cycle cluster; mt = high mitochondrial gene expression cluster). g) Differentially expressed genes per cluster (FDR < 0.05; logistic regression with Bonferroni correction; Supplementary Table 2) per cluster are shown. h) Gene marker expression from erythroid (GATA1, CA1), monocyte (IRF8, LGALS1), megakaryocyte (PF4, PLEK) and neutrophil (MPO, ELANE) cells. i) Frequency of GATA1+ cells for normal (n = 1,035 cells) and DNMT3A-F755S (n = 7,338 cells) clonal hematopoiesis subject. Cells were defined as positive when at least one UMI was detected for GATA1 (two-sided Fisher exact test).
