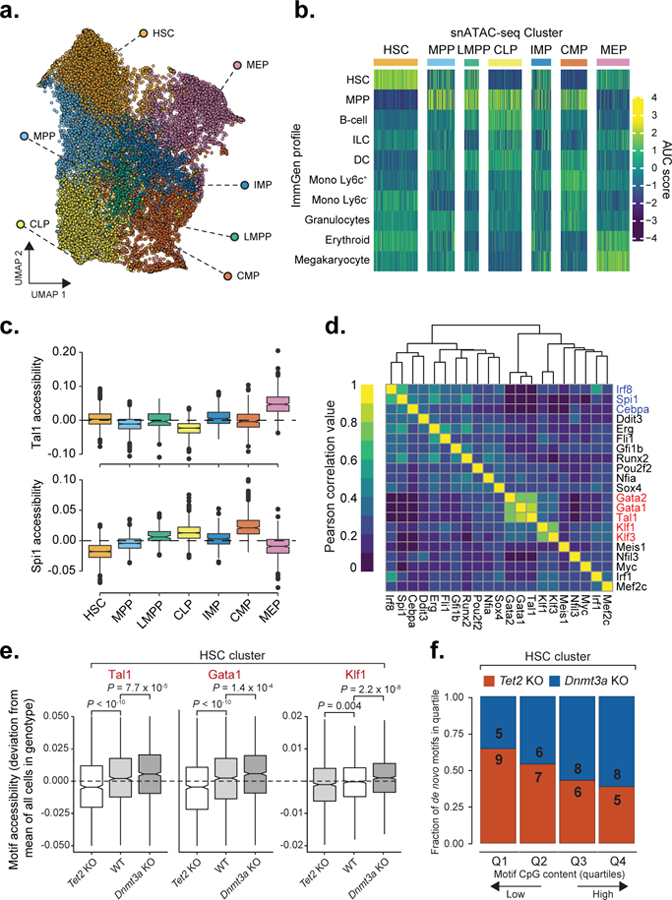
Figure 5. Single-cell ATAC-seq reveals shifts in motif accessibility.

a) Uniform Manifold Approximation and Projection (UMAP) for snATAC-seq data (n = 20,029 cells). HSC = hematopoietic stem cell; MEP = megakaryocyte-erythrocyte progenitor; MPP = multi-potent progenitor; IMP = immature myeloid progenitor; CLP = common lymphoid progenitor; LMPP = lymphoid-primed multi-potent progenitor; CMP = common myeloid progenitor. b) Single cell scores for available bulk ATAC-seq profiles from the ImmGen Database61 of FACS-sorted hematopoietic progenitors (see online methods). c) Single cell motif accessibility deviation scores as a proxy of transcription factor binding activity62 for Tal1 and Spi1 transcription factors for WT (n = 5,810 cells), for each of the defined clusters as calculated by chromVar63 for the DNA binding motifs available from the HOCOMOCO v11 database46. d) Motif accessibility correlation between single cells. Mean accessibility for each transcription factor was calculated using chromVar63, followed by cell-to-cell Pearson correlation of motif accessibility calculated for WT cells from the HSC cluster (n = 1,410 cells) e) Motif accessibility deviation scores comparison between WT (n = 1,410 cells), Tet2 KO (n = 1,173) and Dnmt3a KO (n = 1,305 cells) cells mapped to the HSC cluster (two-sided Wilcoxon rank sum test). f) Mean CpG frequency per base of de novo motifs divided into quartiles based on the CpG content for Tet2 KO (n = 27 motifs) or Dnmt3a KO (n = 27 motifs).
