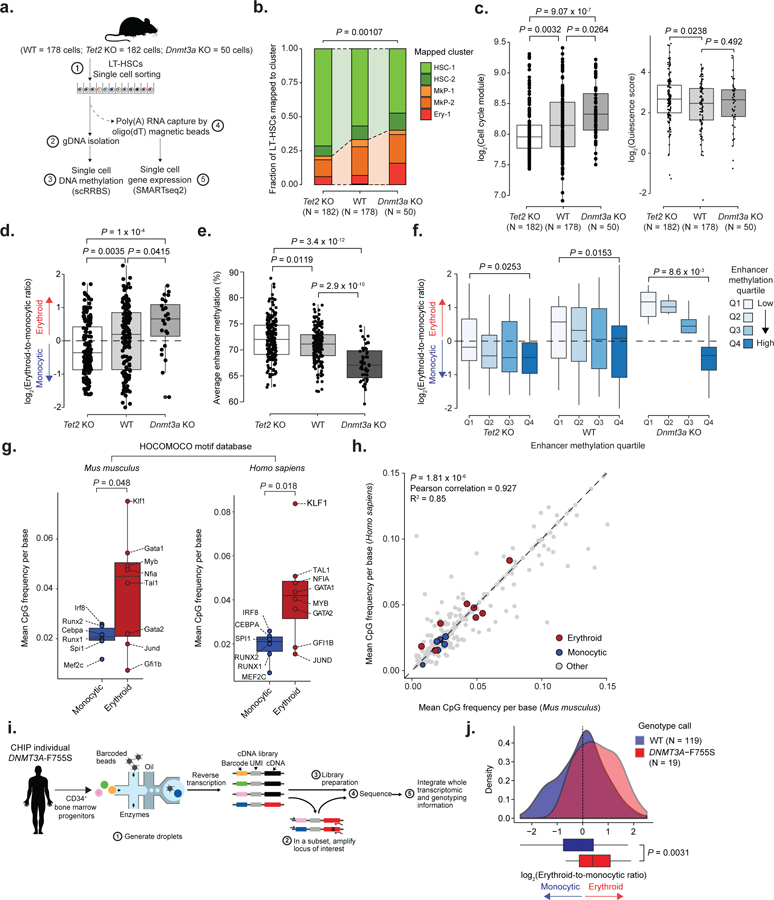
Figure 6. Single-cell multi-omics links enhancer methylation and transcriptional priming, and identifies transcriptional priming skews within a human clonal hematopoiesis sample.

a) Schematic representation of the scRRBS+RNA protocol. b) Frequency of WT (n = 178 cells), Tet2 KO (n = 182 cells) and Dnmt3a KO (n = 50 cells) LT-HSCs mapped by maximum likelihood to the clusters shown in Figure 1b (two-sided Fisher exact test). c) Left panel: Cell cycle analysis of scRNA-seq data for LT-HSCs, comparing WT (n = 178 cells), Tet2 KO (n = 182 cells) and Dnmt3a KO (n = 50 cells) progenitors (two-sided Wilcoxon rank sum test). Right panel: Quiescence score for WT, Tet2 KO and Dnmt3a KO LT-HSCs (two-sided Wilcoxon rank sum test). d) Transcriptional priming scores for WT (n = 178 cells), Tet2 KO (n = 182 cells) and Dnmt3a KO (n =50 cells) LT-HSCs (two-sided Wilcoxon rank sum test). e) Single cell average enhancer methylation for WT (n = 178 cells), Tet2 KO (n = 182 cells) and Dnmt3a KO (N =50 cells) LT-HSCs (two-sided Wilcoxon rank sum test). f) Transcriptional priming scores per average enhancer methylation quartile for WT (n = 178 cells), Tet2 KO (n = 182 cells) and Dnmt3a KO (N =50 cells) progenitors (first quartile vs. fourth quartile; two-sided Wilcoxon rank sum test). g) Mean CpG frequency per base for either Mus musculus or Homo sapiens transcription factor binding motifs (n = 335 motifs) extracted from the HOCOMOCO v1146 database (two-sided Students t-test). h) Mean CpG frequency per base correlation between Mus musculus and Homo sapiens transcription factor binding motifs (Pearson correlation). i) Schematic representation of the procedure to link single cell genotypes to scRNA-seq profiles. j) Intra-sample transcriptional priming for the clonal hematopoiesis sample, comparing WT and DNMT3A-F755S CD34+ bone marrow progenitor cells (two-sided Students t-test).
