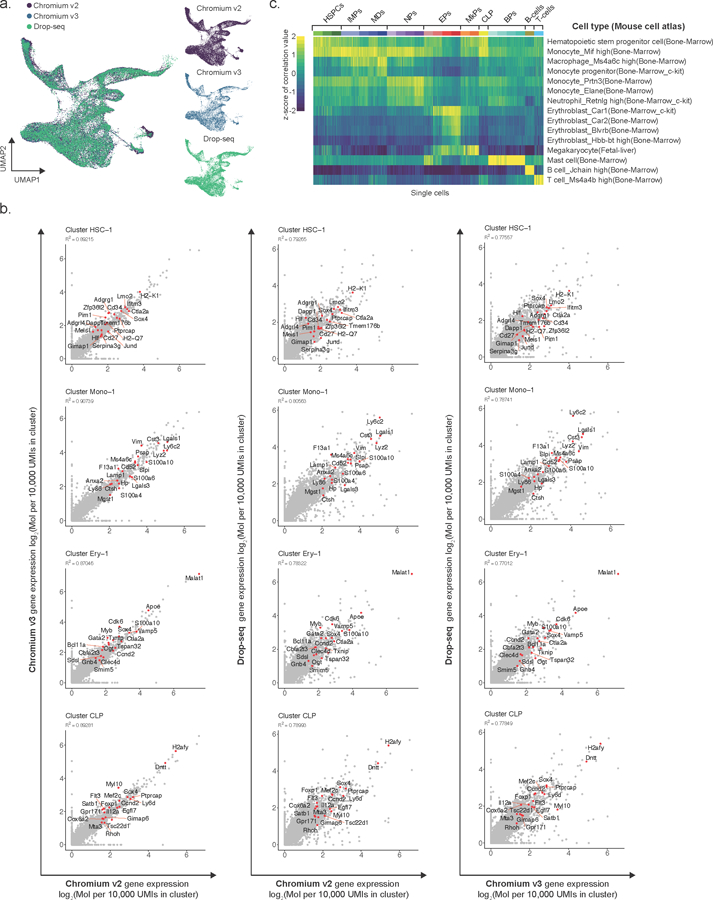
Extended Data Fig. 3. Quality control of joint embedding across single cell technologies.

a) Left panel: Uniform Manifold Approximation and Projection (UMAP) dimensionality reduction showing joint embedding of WT (17,702 cells; n = 7 mice), Tet2 KO (18,651 cells; n = 7 mice), Dnmt3a KO (13,858 cells, n = 4 mice) and Idh2-R140Q (9,883 cells, n = 3 mice) lineage-negative hematopoietic progenitors. Right panels: UMAP embedding obtained for each scRNA-seq method is shown separately. b) Gene expression correlation between cells obtained by different scRNA-seq methods (Chromium v2, Chromium v3 and Drop-seq) that were mapped to the same cell cluster. The gene expression frequency was calculated as the number of unique molecular identifiers (UMIs) mapping to a given gene relative to the total number of UMIs detected for a given cluster, and multiplied by a factor of 105. The log2 of the pseudo-bulk gene expression is shown (R2 values were obtained from Pearson correlation; red dots highlight the top gene markers for each cluster). c) Gene expression correlation between WT cells and expression profiles from the Mouse Cell Atlas64 dataset, as obtained by scMCA65 (see online methods).
