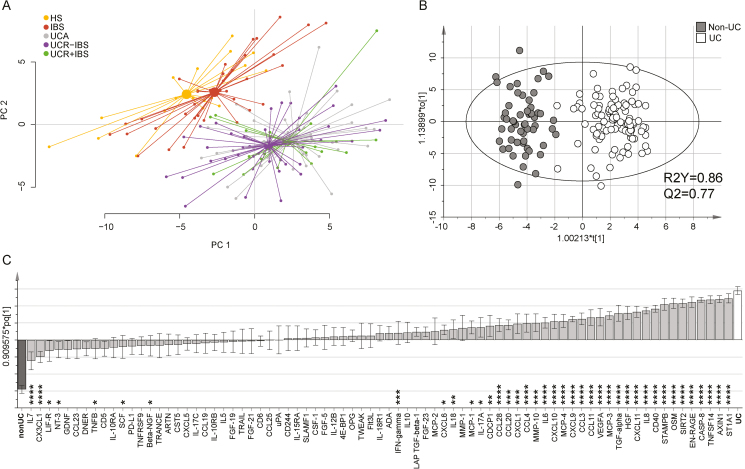
FIGURE 1.
Systemic inflammatory protein profile in healthy subjects, patients with IBS, and patients with UC. Serum proteins related to inflammation were analyzed by proximity extension assay and are presented in arbitrary unit NPX. A, Principle component analysis including all 77 proteins analyzed for HS (n = 19, yellow), IBS (n = 37, red), UC with active disease (n = 40, gray), UC in remission without IBS-like symptoms (n = 44, green), and UC in remission with IBS-like symptoms (n = 19, purple). Lines connect each group to a centroid that shows the combined mean of the group. B, Score scatter plot and (C) loading column plot from an OPLS-DA based on all 77 proteins analyzed in relation to non-UC (HS and IBS, n = 56, gray) and UC (all UC patients irrespective of disease activity, n = 103, white) as y-variables. R2Y defines the goodness of fit, and Q2 the goodness of prediction. The Mann-Whitney U test and false discovery rate analysis were used to compare the data in (C): *q < 0.05; **q < 0.01; ***q < 0.001; and ****q < 0.0001.

