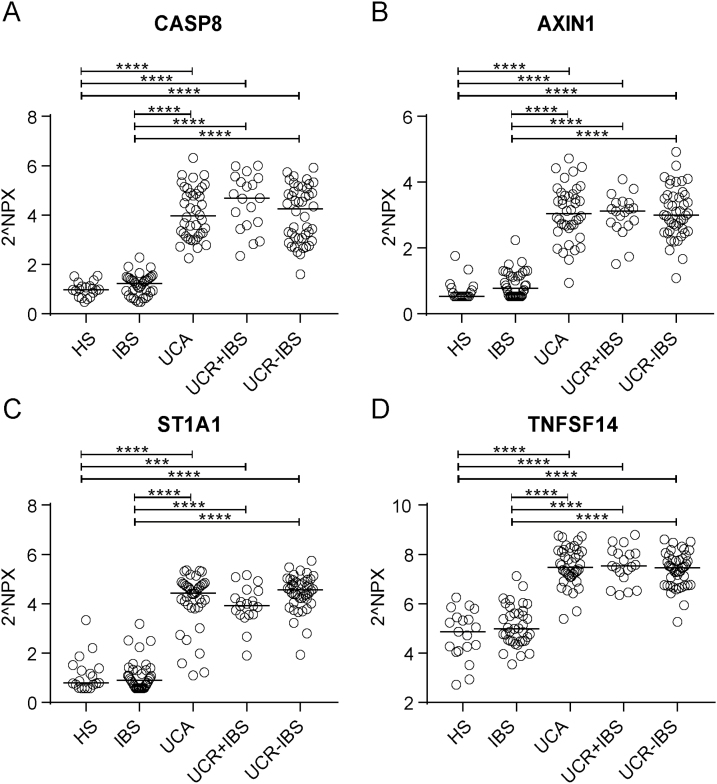
FIGURE 2.
Serum levels of CASP8, AXIN1, ST1A1, and TNFSF14 in healthy subjects, IBS patients, and UC patients. Protein expression in serum was analyzed by proximity extension assay and is presented in arbitrary unit NPX. Serum protein levels of CASP8 (A), AXIN1 (B), ST1A1 (C), and TNFSF14 (D) in HS (n = 19), IBS (n = 37), UC with active disease (n = 40), UC in remission with IBS-like symptoms (n = 19), and UC in remission without IBS-like symptoms (n = 44). Statistical difference between groups was assessed by Kruskal-Wallis test followed by Dunn’s multiple comparisons test; only significant differences are shown: ***P < 0.001; ****P < 0.0001. Each symbol represents 1 individual, and horizontal lines indicate the median of the group.

