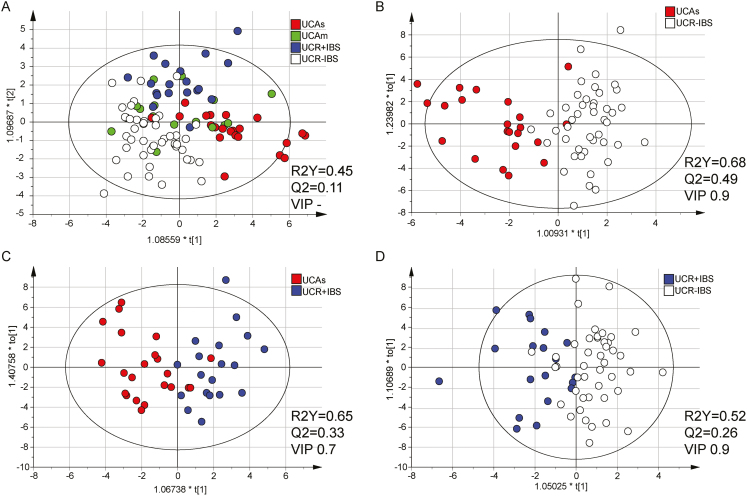
FIGURE 3.
Systemic inflammatory protein profiles in patients with UC. Serum proteins related to inflammation were analyzed by proximity extension assay and are presented in arbitrary unit NPX. OPLS-DA analyses with serum proteins as x-variables and patient groups as y-variables are shown. Variable influence on projection cutoffs were used, as indicated in the figure, to select the number of x-variables resulting in the best model based on the R2Y and Q2 values. A, Score scatter plot including patients with UC with moderate/severe disease (Mayo score ≥6, n = 22, red), mild disease (Mayo score 3–5, n = 17, green), remission with IBS-like symptoms (n = 19, blue), and remission without IBS-like symptoms (n = 44, white) as y-variables. The analysis includes all 77 proteins, as no VIP was used. B, Score scatter plot of 36 proteins (VIP > 0.9) including patients with UC having severe active disease (Mayo score ≥6, n = 22, red) and UC in remission without IBS-like symptoms (n = 44, white) as y-variables. C, Score scatter plot of 53 proteins (VIP > 0.7) including patients with UC having severe active disease (Mayo score ≥6, n = 22) and UC in complete remission with IBS symptoms (n = 19, blue) as y-variables. D, Score scatter plot of 45 proteins (VIP > 0.9) including patients with UC in complete remission with IBS symptoms (n = 19, blue) and without IBS symptoms (n = 44, white) as y-variables. R2Y defines the goodness of fit, and Q2 the goodness of prediction. Based on Hotelling’s T2 Range Line and DModX DCrit, 1 outlier was excluded from the UCAm group.

