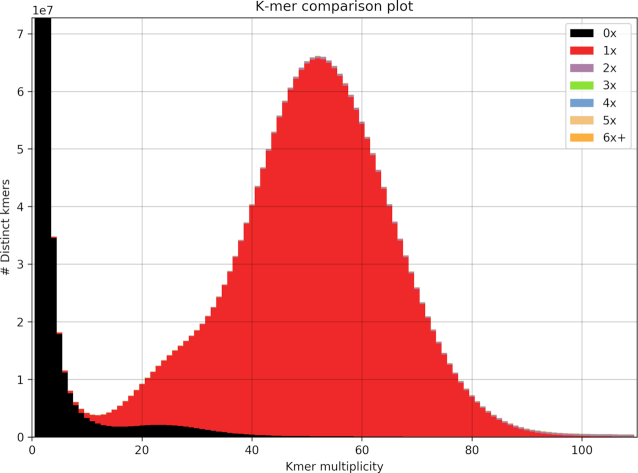
Figure 4:
KAT k-mer plots comparing k-mer content of Illumina PCR-free reads with w2rap assembly (A1). The black area of the graph represents the distribution ofk-mers present in the reads but not in the assembly, and the red area represents the distribution of k-mers present in the reads and once in the assembly.

