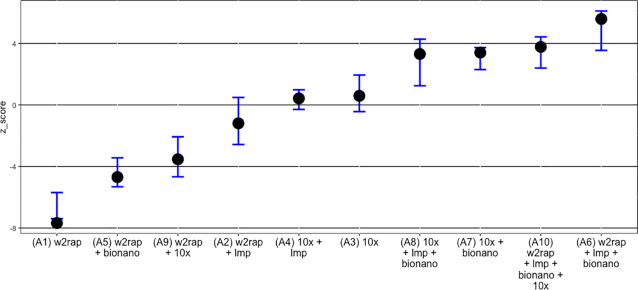
Figure 7:
Cumulative z-scores of assemblies (solid black circles). Error bars represent the minimum and maximum cumulative z-score after removing each metric in turn and recalculating the z-score for each assembly. Wide error bars show assemblies that are strongly affected by a given metric. For example, the 10x + lmp + bionano assembly (A8) has a long lower-boundary error bar because it has an exceptionally high scaffold N50 z-score (double that of the next nearest ranking assembly) and hence omitting this metric results in the assembly scoring much lower.

