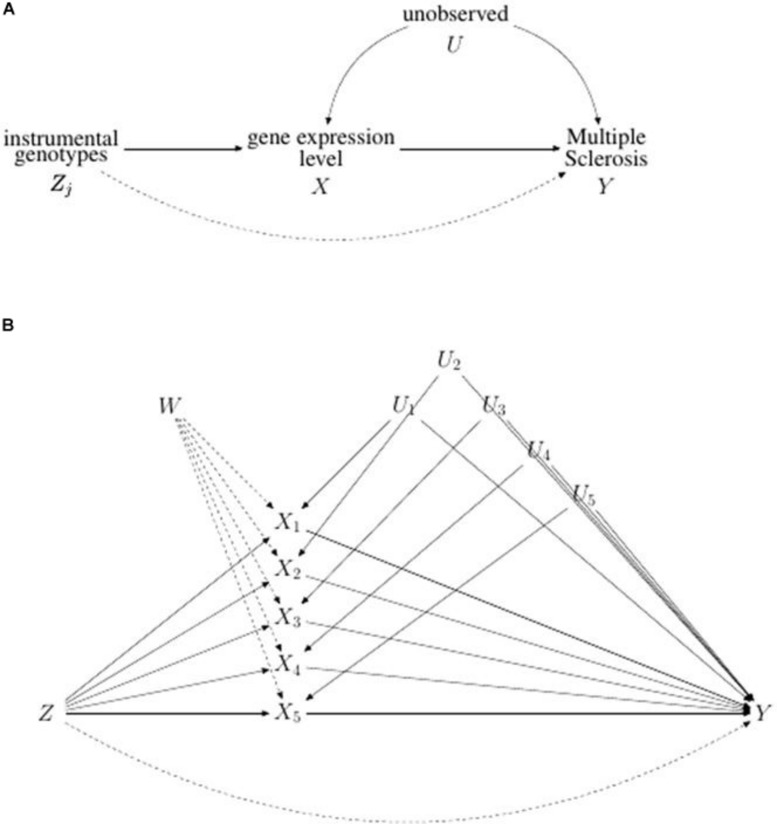
FIGURE 2.
Directed acyclic graph illustrating (A) the univariable and (B) the multivariable Mendelian Randomization problem. In (A) the potential violation of IV assumption represented by the direct pleiotropic effect of Zj on Y is indicated by a dotted line. In (B) causal graph illustrating multivariable Mendelian randomization assumptions for a set of genetic variants Z, five risk factors X1, X2, X3, X4 and X5, and the binary outcome Y. The direct pleiotropic effect of Z on Y is represented by a dotted line. The node W represents the possibility that each risk factor, X, could influence each other.

