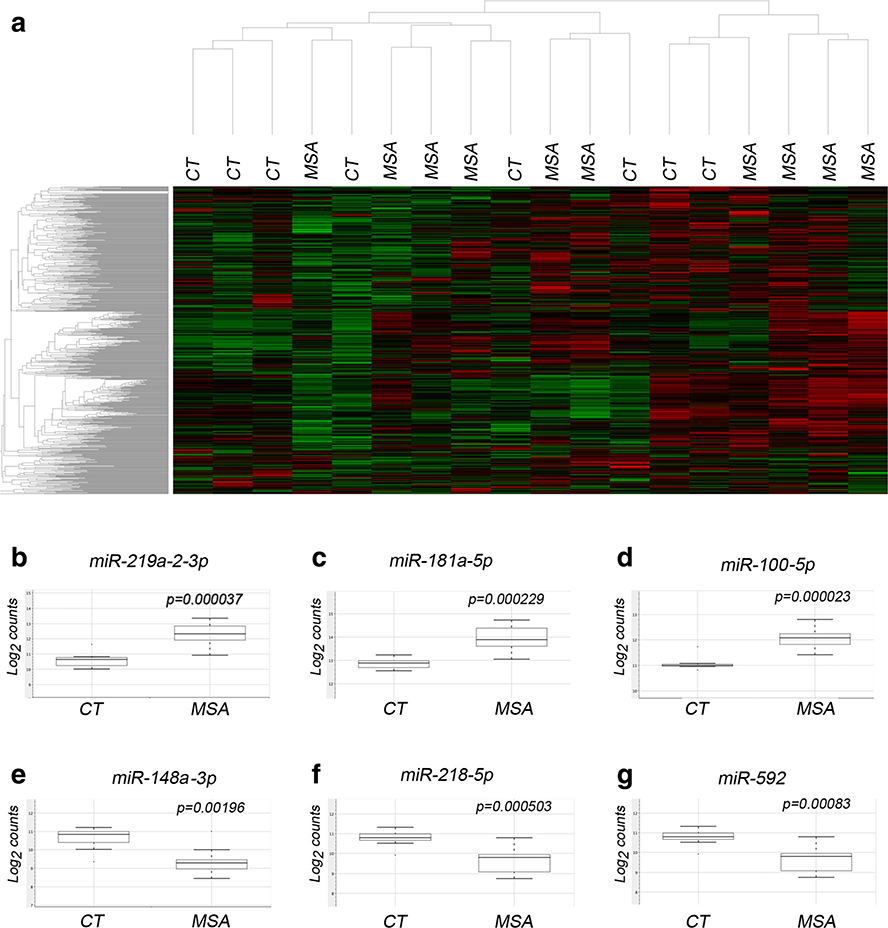
Fig. 1.
Alterations in miRNA expression in the striatum of MSA cases. a Heat map representing the agglomerative clustering of raw miRNA abundance data plotting average Euclidean distance. Representative box plots of top upregulated (b-d) or downregulated (e-g) miRNAs in MSA showing non-parametric analysis of normalized data displaying data range and quartiles, P value as per t test

