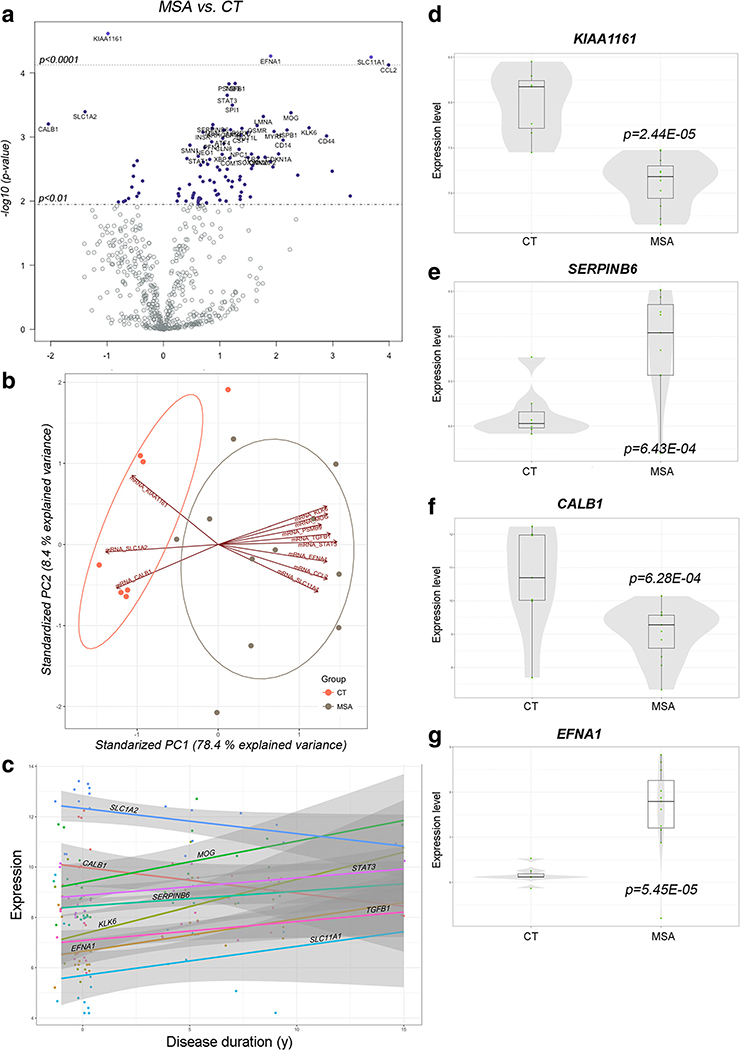
Fig. 2.
Differential expression of genes involved in neurodegeneration in the MSA striatum. a Volcano plot displaying genes differentially transcribed in MSA with high statistical significance. Labels for the 40 top genes are indicated in the plot. b Principal component analysis biplot including the 15 most significant differentially expressed genes. Projections in opposite directions in PC1 indicate high-degree contribution of the indicated genes in clustering. c Trend plot for visualization of changes in expression as a function of disease progression. Color lines indicate trajectory. Transcription showing higher degree of change is labeled in the graph. d-g Univariate plots showing expression of select genes. Box plots depict median and second quartile of expression. Overlying violin plots (gray) show log2 expression quartiles and the estimated distribution of expression levels. P values indicated as per Student t test

