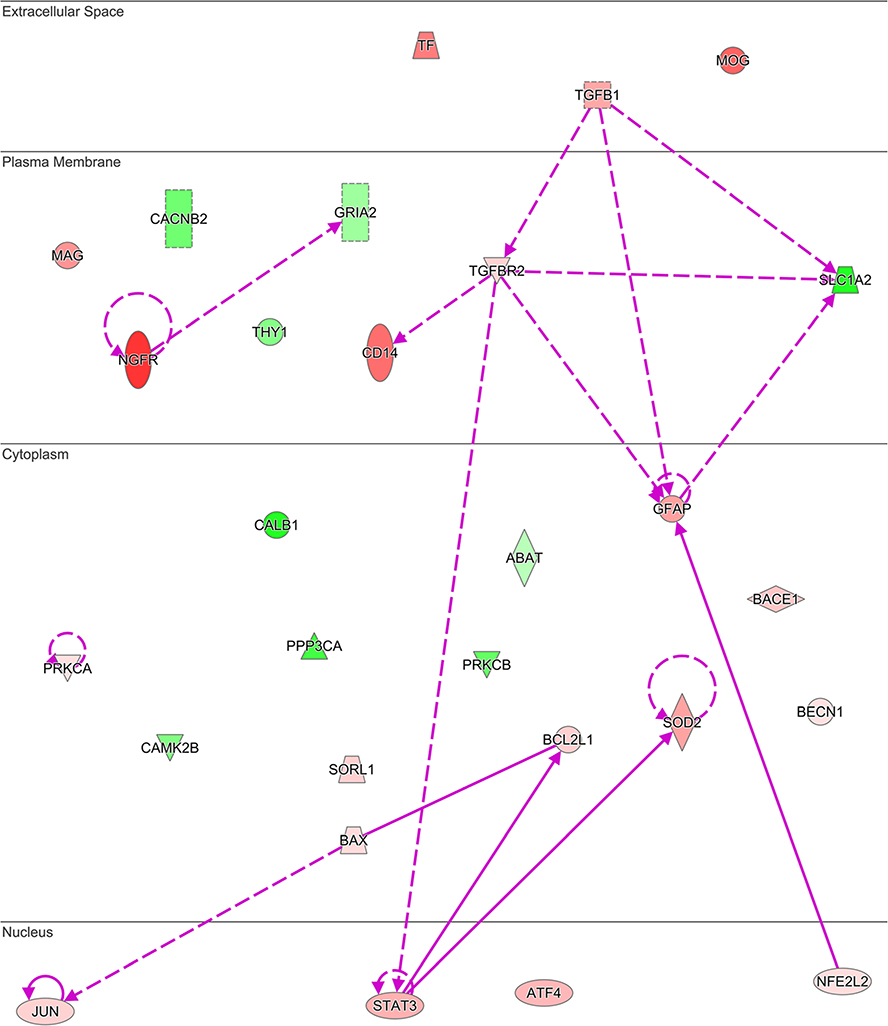
Fig. 4.
Genes with altered expression in MSA striatum overlap networks associated with Alzheimer’s disease neuropathology. Network built using 29 genes showing differential transcription in MSA that were associated to AD in the disease enrichment analysis module of IPA. Red shades indicate increased and green shades indicate decreased expression in the data with intensity of shading representing fold change magnitude. Solid lines denote direct and dash lines indicate indirect interactions between gene products. Arrowheads denote reaction direction

