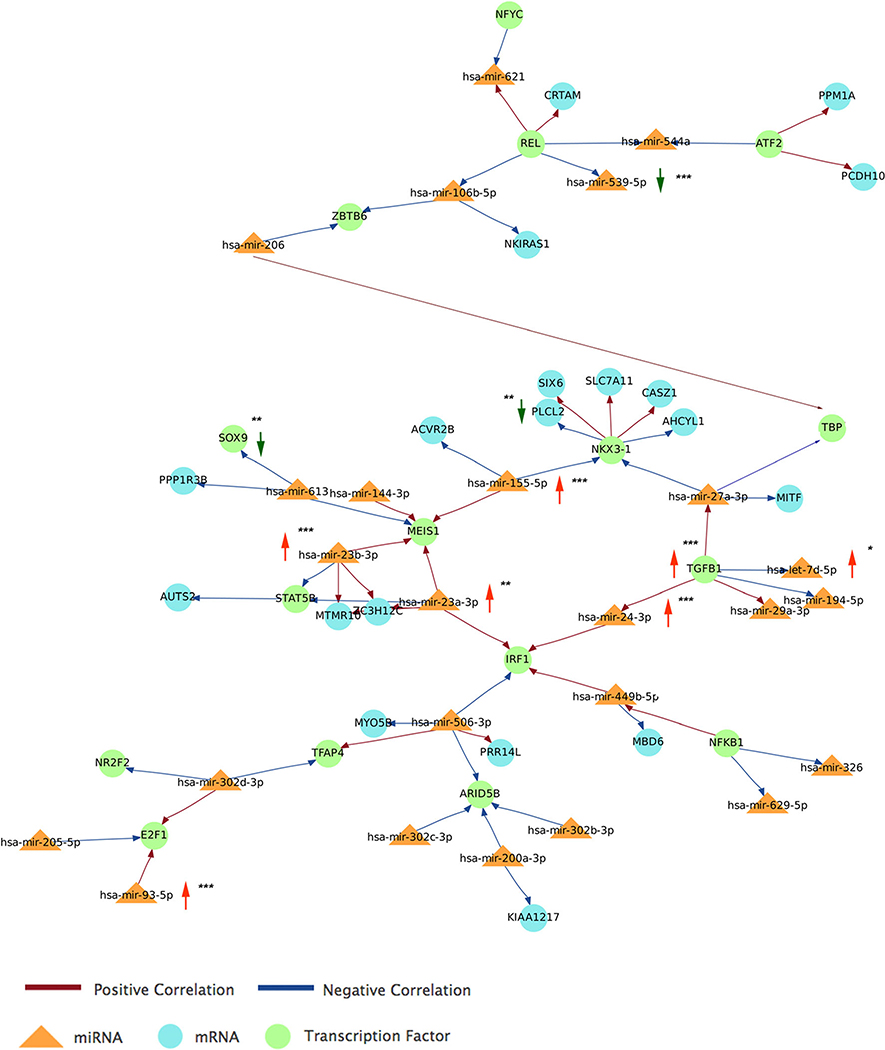
Fig. 6.
Generation of expanded networks linking miRNAs altered in MSA, transcription factors, and additional regulatory molecules. Main network obtained by integrative analysis of paired miRNAs and gene targets affected in MSA and expanded by Pearson’s correlation and TargetScan prediction tools in Magic2. Vertical arrows indicate miRNAs and transcripts altered in MSA brains (red = increased, green = decreased abundance). *P <0.05, **P < 0.01, and ***P <0.001 as per t test in the group comparisons (MSA vs. CT)

