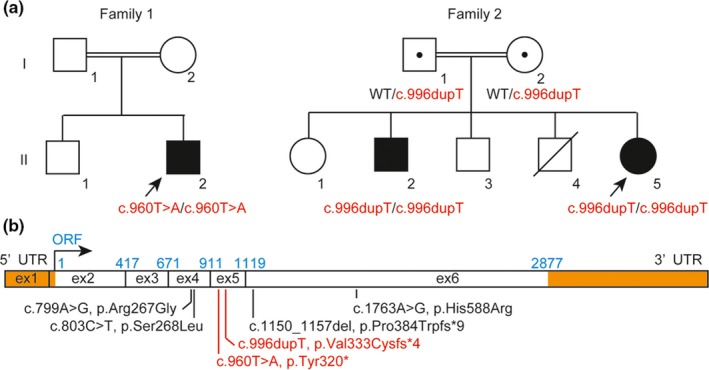
Figure 2.

Molecular investigation. (a) Pedigree information and intrafamilial segregation of detected variants in DSE. (b) cDNA structure of DSE and pathogenic variants (mcEDS‐DSE). Untranslated regions (UTRs) are shown as orange bars. The first base and each position of exon‐exon junctions in open reading frames (ORFs) are shown in light blue. Pathogenic variants reported in this study are shown in red characters. ex: exon
