Figure 2.

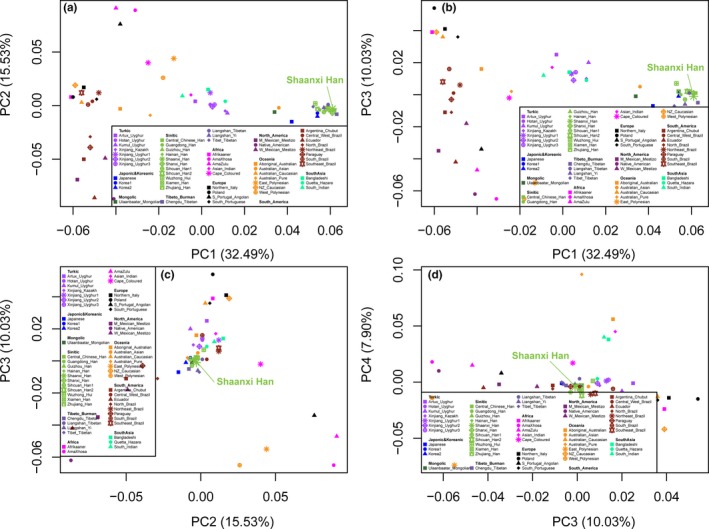
Principal component analysis among 56 worldwide populations based on the allele frequency distribution. (a–d) Two‐dimensional plots respectively reconstructed based on the random combination of the top four components

Principal component analysis among 56 worldwide populations based on the allele frequency distribution. (a–d) Two‐dimensional plots respectively reconstructed based on the random combination of the top four components