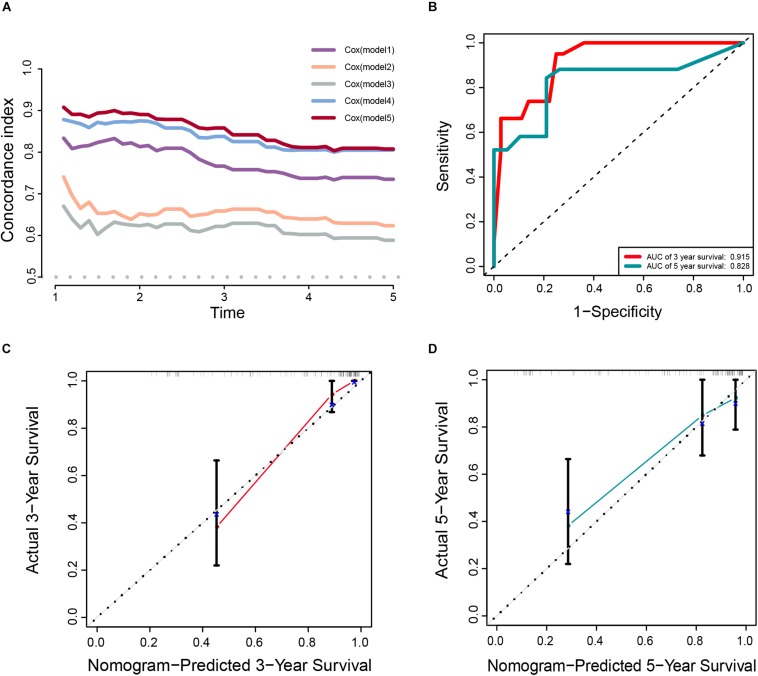
FIGURE 7.
(A) The calculation of the C-indexes in five models. (B–D) Internal validation of a prognostic stemness index-related gene signature for primary LGG. (B) Time-dependent ROC curve of the seven-gene-based risk score for 3- and 5-year OS probability in the internal validation cohort. Calibration plot for internal validation of 3- (C) and 5-year (D) OS of primary LGG patients.

