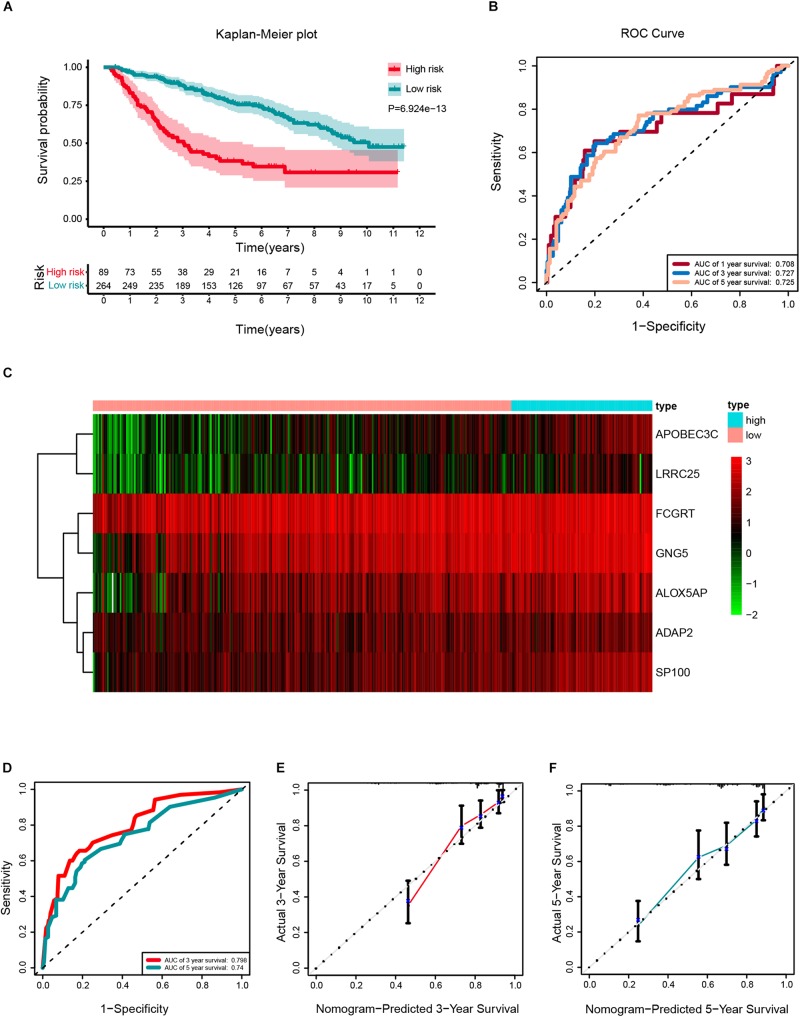
FIGURE 8.
External validation of a prognostic stemness index-related gene signature for primary low-grade glioma (LGG). (A) Kaplan-Meier analysis of OS for low-risk and high-risk patients in the external validation cohort. Additionally, the table indicating the number at risk for each group at corresponding time points. (B) The time-dependent receiver operating characteristics (ROC) curve for 1-, 3-, and 5-years OS predictions for the nomogram compared with actual observations. (C) The heatmap shows the expression of the seven genes between two risk groups in the CGGA cohort. (D) Time-dependent ROC for 3- and 5-years OS predictions for the nomogram compared with actual observations. Calibration plot of nomogram for predicting probabilities of 3- (E) and 5-year (F) OS of primary LGG patients in the CGGA database.

