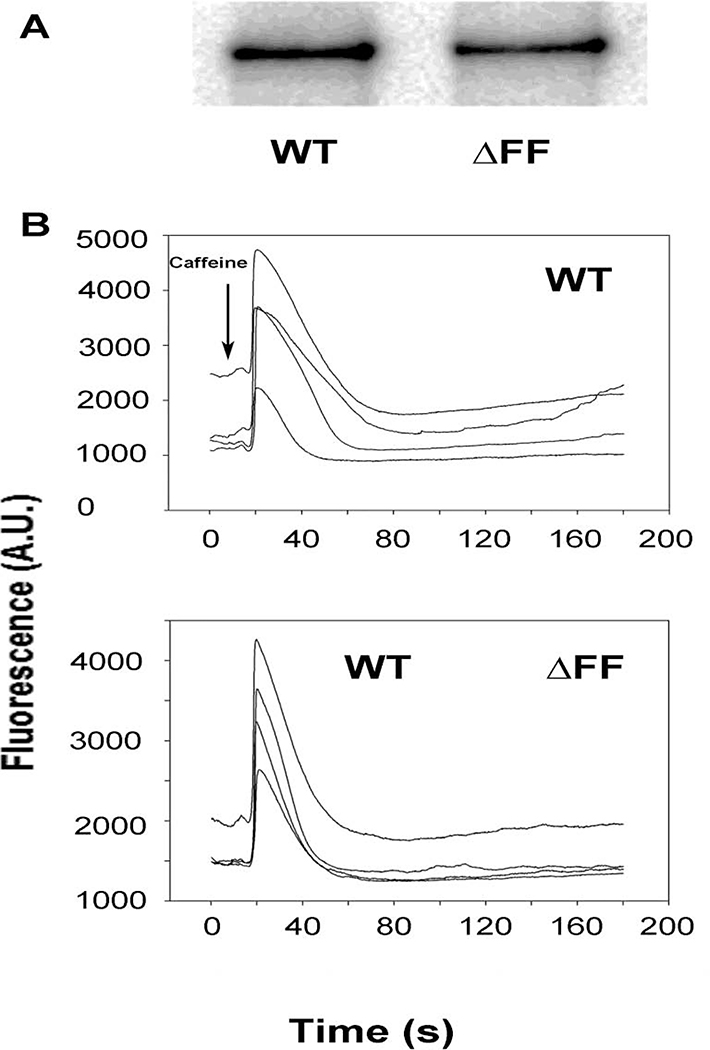
Figure 2. Immunoblot and caffeine-induced Ca2+ release measured in HEK293 cells expressing RyR1-WT or RyR1-ΔFF.
(A) Immunoblots of HEK293 cells transfected with pCMV5-RyR1-WT or pCMV5-RyR1-ΔFF show 565 kDa WT and ΔFF bands. Both bands are absent in cells transfected with pCMV5 vector (not shown). (B) Ca2+ transients in HEK293 cells expressing WT-RyR1 or RyR1-ΔFF as changes of Fluo-4 fluorescence before and following the addition of 8 mM caffeine (arrow) to the bath solution. A.U., arbitrary units.

