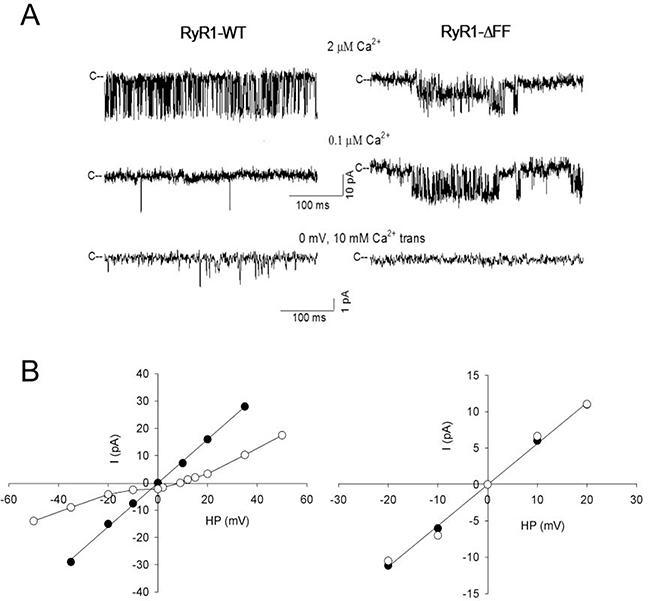
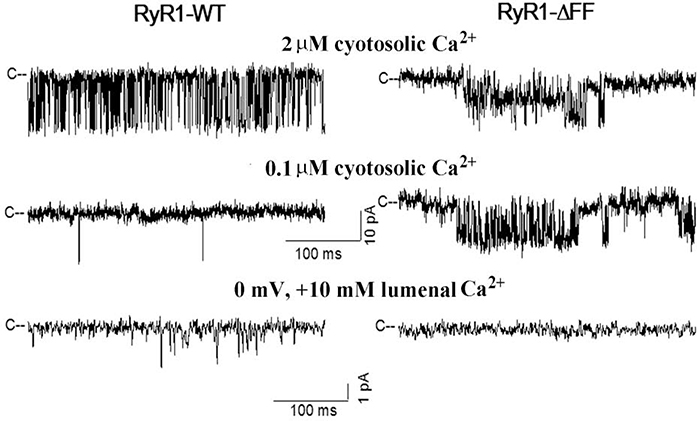
Figure 3. Single-channel measurements of homotetrameric RyR1-WT and RyR1-ΔFF channel complexes.
(A) Representative single-channel currents at −20 mV (upper and middle traces) or 0 mV (bottom traces) shown as downward deflections from the closed states (c−) in symmetrical 0.25 M KCl with 2 μM Ca2+ in the cis chamber (upper traces) and after the subsequent addition of EGTA to yield free Ca2+ of 0.1 μM (middle traces) or after the addition of 10 mM Ca2+ to the trans chamber (bottom traces). (B) Representative current-voltage relationships in 0.25 M symmetrical KCl (●) and after the addition of 10 mM trans Ca2+ (○). Current and time scales for single-channel traces are shown. Averaged Po values and ion permeation properties are summarized in Table 1.


