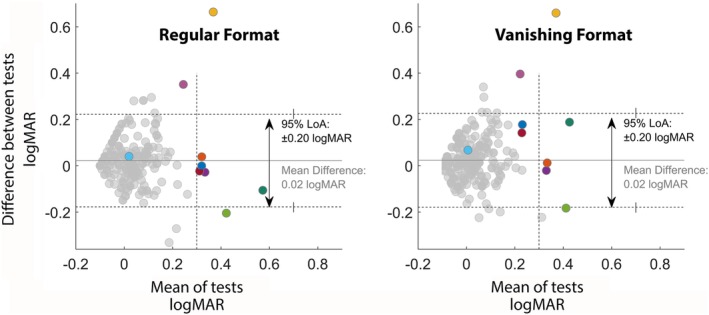
Figure 3.

Bland–Altman plots for comparison of Lea symbols to each format of The Auckland Optotypes (TAO) for the weaker eye. The solid line is mean difference between tasks, dotted lines represent 95 per cent limits of agreement (LoA) (with 95 per cent confidence intervals – solid vertical lines). Participants meeting fail criteria are again highlighted in the legend.
