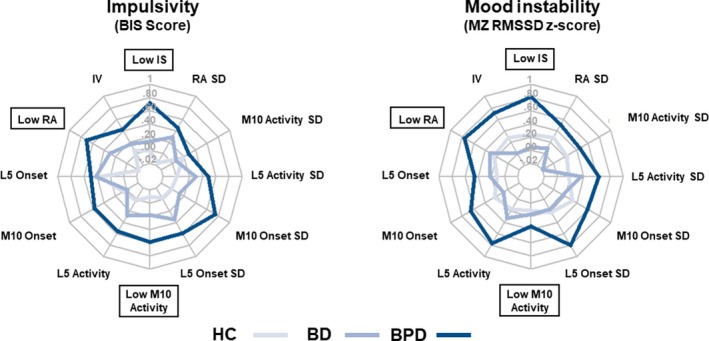
Figure 1.

Correlation between sleep/circadian rhythm parameters and symptoms. Radar plots indicate partial correlation coefficient strength between rest‐activity pattern variables and symptoms of impulsivity and mood instability for healthy controls and diagnostic groups. BPD consistently show stronger association between symptoms and parameters indicating perturbed and delayed rest‐activity profile. Negative correlations (e.g. for interdaily stability, relative amplitude and M10 activity) were reversed and renamed for visual consistency such that higher values uniformly indicate stronger association. Labels enclosed in boxes indicate a negative relation. [Colour figure can be viewed at http://www.wileyonlinelibrary.com/]
