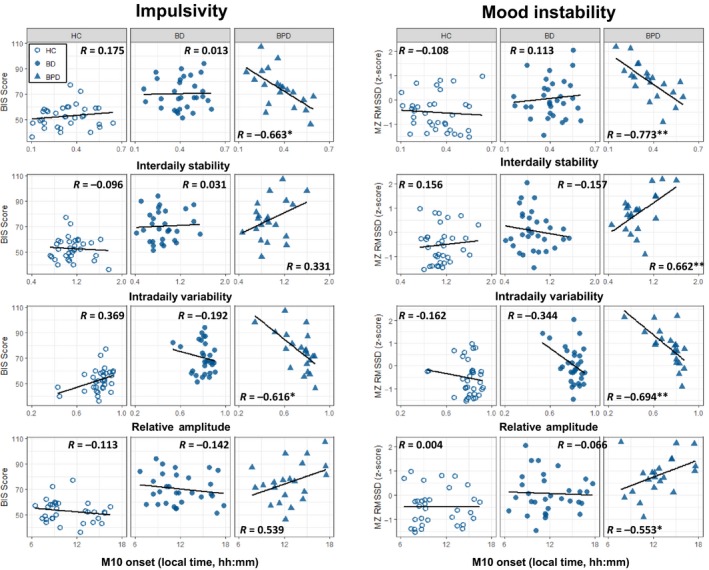
Figure 2.

Scatter plots indicating the relationship between sleep/circadian rhythm parameters and symptoms. Scatter plots representing the partial correlation analysis conducted between rest‐activity variables (IS, IV, RA and M10 onset) and impulsivity and mood instability are depicted for each group (HC, BD and BPD). * indicates P < 0.05; ** indicates P < 0.01. All P‐values are adjusted for FDR as per Table S4. [Colour figure can be viewed at http://www.wileyonlinelibrary.com/]
