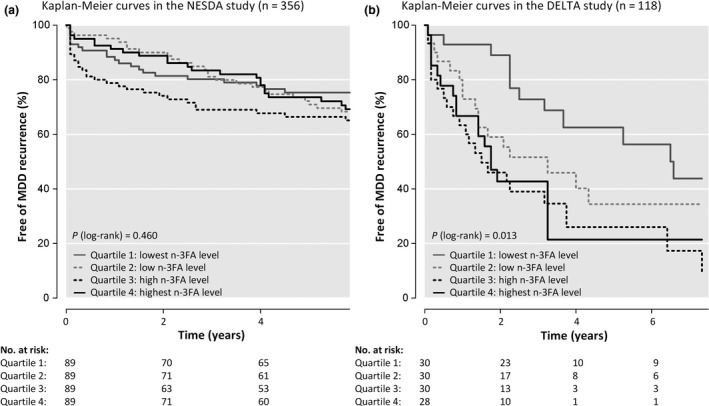
Figure 2.

Kaplan–Meier curves in (a) the NESDA study (n = 356) and (b) the merged DELTA study (n = 118). NESDA (N = 356): n = 98 recurrences, n = 47 loss to follow‐up, and n = 211 administrative censoring. DELTA (N = 118): n = 67 recurrences, n = 24 loss to follow‐up, and n = 27 administrative censoring.
