Figure 4.

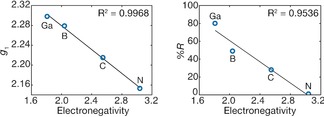
Linear trends of observed g 1‐value (left) and rhombicity (%R, right) vs. Pauling electronegativity value of the ligand.

Linear trends of observed g 1‐value (left) and rhombicity (%R, right) vs. Pauling electronegativity value of the ligand.