Figure 6.

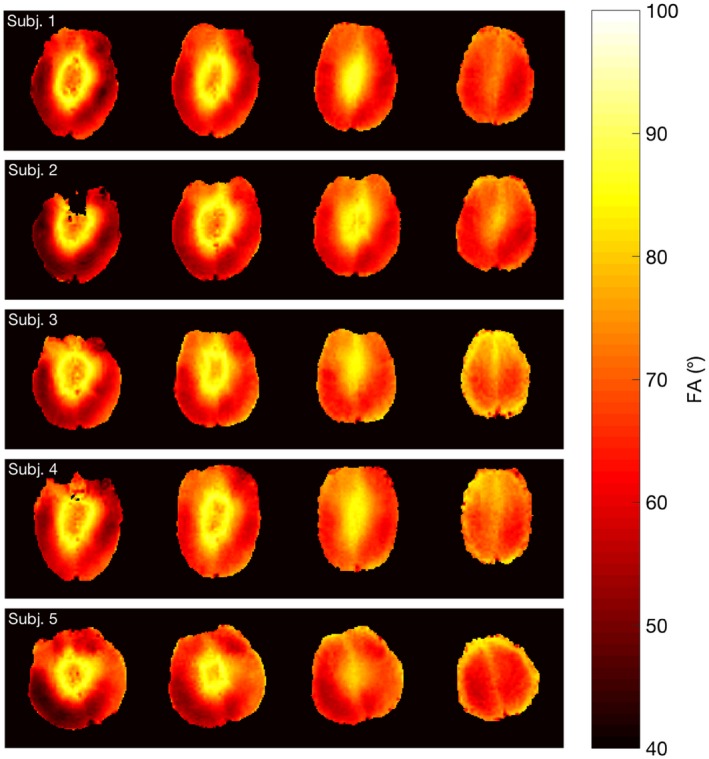
Expected FA maps of the imaging slices (slices 5, 8, 11, 14) from 5 subjects produced by the 90° excitation pulse. The FA maps were calculated based on the excitation pulse voltage and interpolated per volt maps

Expected FA maps of the imaging slices (slices 5, 8, 11, 14) from 5 subjects produced by the 90° excitation pulse. The FA maps were calculated based on the excitation pulse voltage and interpolated per volt maps