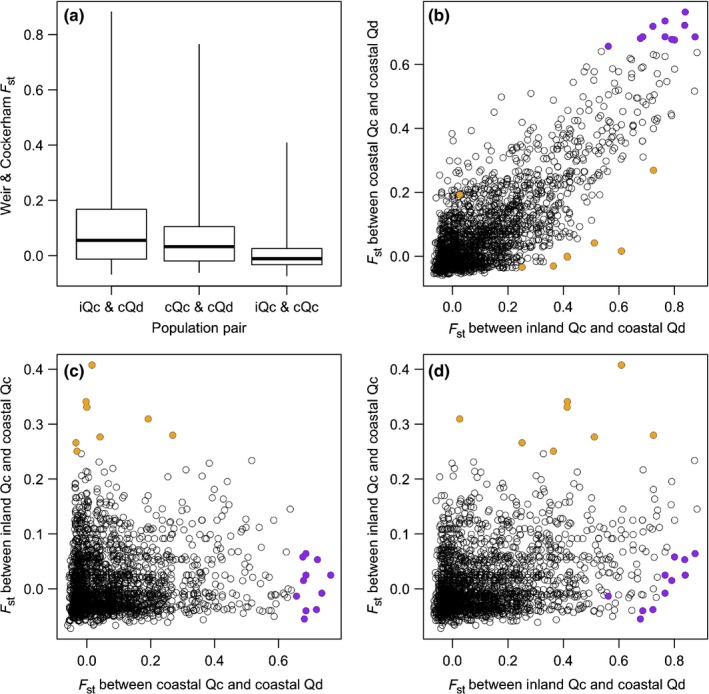
Figure 4.

Weir and Cockerham's F ST at double‐digest restriction‐site‐associated DNA sites in pairs of three populations, inland Quercus mongolica var. crispula (Qc), coastal Qc, and coastal Quercus dentata (Qd). (a) Box plots of F ST values in three pairs of inland Qc (iQc), coastal Qc (cQc), and coastal Qd (cQd) populations. Boxes indicate the first and third quartiles, and whiskers indicate ranges. (b–d) Relationships in F ST values between two of the three populations. Orange circles indicate sites with relatively high (> 0.25) F ST values between iQc and cQc populations. Purple circles indicate sites with relatively high (> 0.65) F ST values between cQc and cQd populations.
