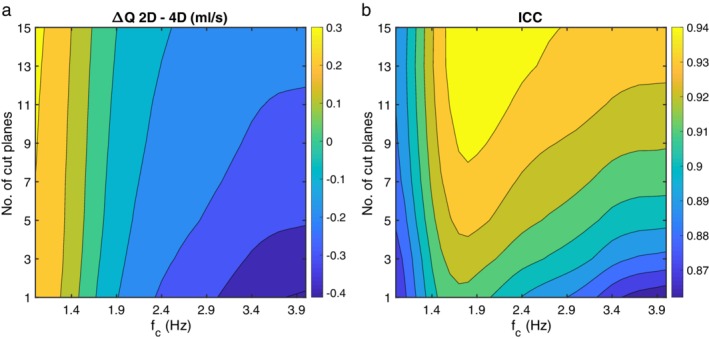
Figure 2.

(a) Mean difference (ml/s) of flow peak‐to‐peak waveform amplitudes (ΔQ), and (b) ICC between 2D PC‐MRI and 4D flow MRI, for the range of cutoff frequencies (fc) of the low‐pass filter (horizontal axis) and the number of cut planes (vertical axis). The color bar to the right of each figure shows the magnitude of the mean difference and the ICC, respectively.
