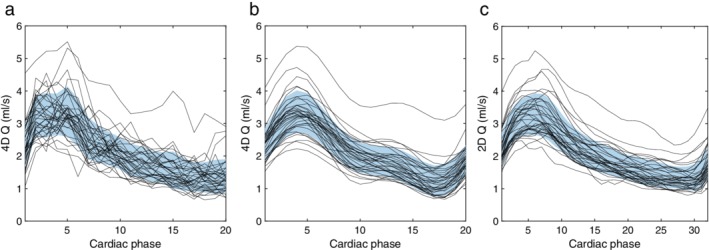
Figure 4.

Flow rate waveform of the right MCA for each of the 35 subjects. (a) Unfiltered and (b) filtered waveforms from 4D flow MRI data and (c) reference waveforms from 2D PC‐MRI data. The blue region is the mean value in each cardiac phase, with ±1 SD in width.
