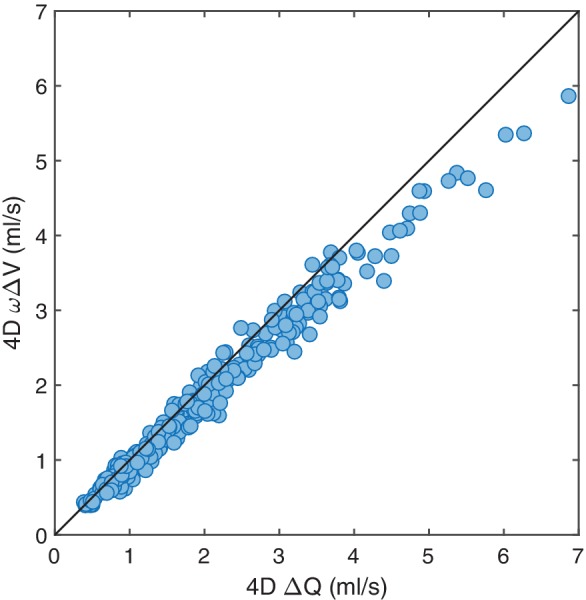
Figure 6.

Correlation between the ΔQ and the corresponding ωΔV for the arterial waveforms measured with 4D flow MRI for all arteries (n = 310). The frequency (ω) was related to heart rate (HR) by ω = 2πHR/60. The ICC was 0.97. The solid line represents the line of equality.
