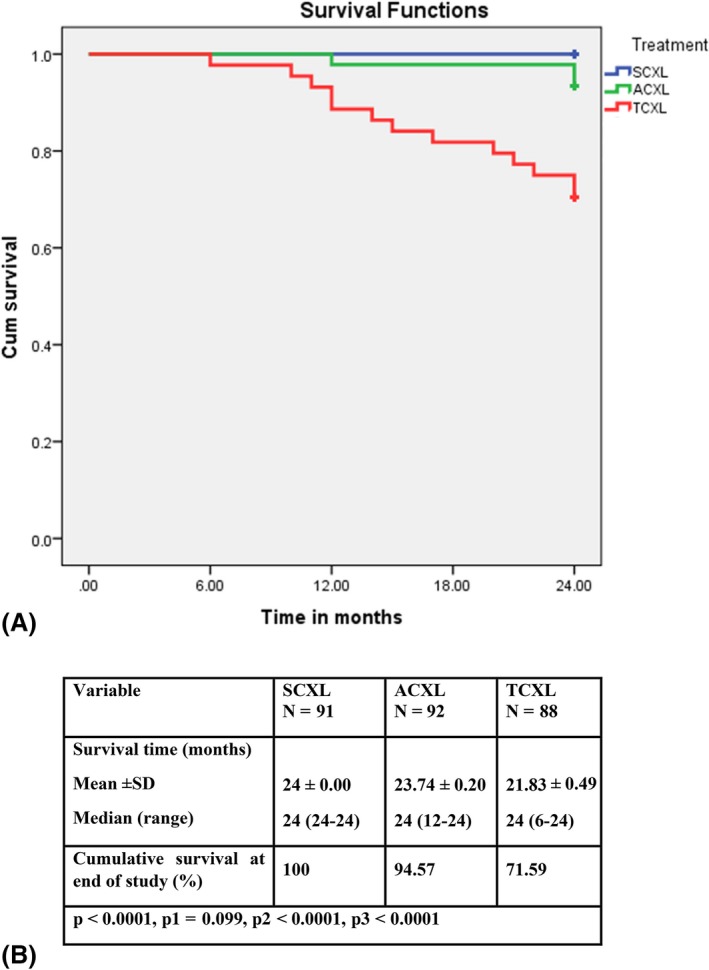
Figure 2.

Kaplan–Meier analysis; A, Kaplan–Meier survival curves (showing ability of the cornea to survive functionally after halting of progression of keratoconus by CXL) for the three study groups depending on postoperative Kmax progression (˃1 D); B, Mean postoperative survival time (months during which CXL successfully halted progression of keratoconus and after which CXL failure was documented or the study ended) in the three study groups. Log‐rank test. P, difference between the three groups; P1, difference between SCXL and ACXL; P2, difference between SCXL and TCXL; P3, difference between ACXL and TCXL; ACXL, accelerated epithelium‐off cross‐linking; SCXL, standard epithelium‐off cross‐linking; TCXL, accelerated epithelium‐on cross‐linking
