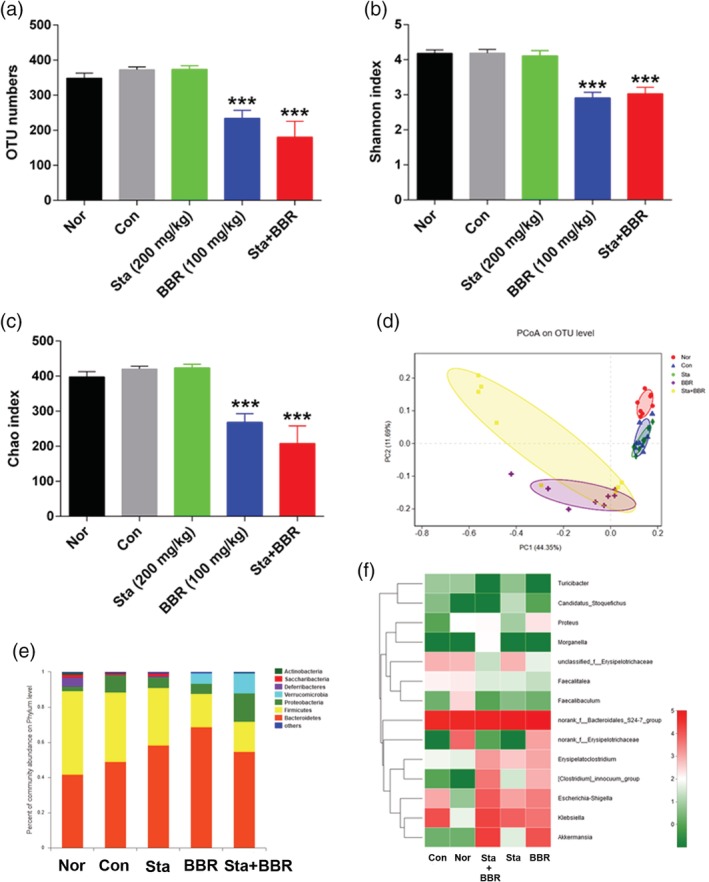
Figure 3.

Effects of berberine combined with stachyose on the structure of microbiota. (a) Total OTU numbers. (b) Shannon index. (c) Chao index. (d) Principal coordinate analysis (PCoA). (e) Relative abundance of bacteria at the phylum level by taxon‐based analysis. (f) Heat map of relative abundance of some bacteria at the genus level. Data are expressed as mean ± SE for (a–c); n = 8. ***p < .001 versus Con. BBR, berberine; Con, diabetic control; Nor, healthy control; Sta, stachyose
