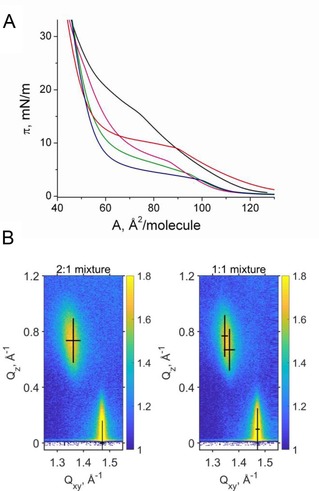
Figure 3.

A) Pressure‐area isotherms of DPPG (red), DP3adLPG (black) and the DPPG/DP3adLPG mixtures 2 : 1 (blue), 1 : 1 (green) and 1 : 2 (magenta) on a pH 7.4 subphase containing 1 mM CsBr at 20 °C. B) GIXD data (scattered intensity vs. the vertical and horizontal components of the scattering vector) of the DPPG/DP3adLPG 2 : 1 and 1 : 1 mixtures at 30 mN ⋅ m−1 and the fitted Bragg peak and rod positions (black crosses). The width and the length of the crosses represent the FWHM of the peak and the corresponding rod.
