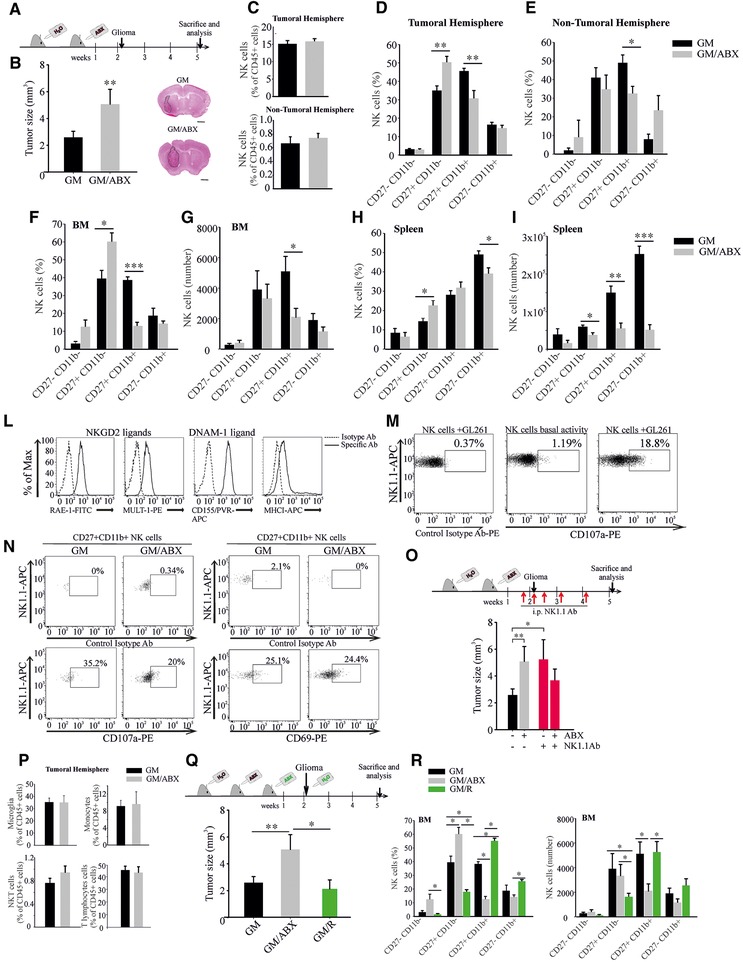
Figure 1.

Tumor size and NK cell alterations in ABX‐treated tumor‐bearing mice. (A) Study design. (B) Tumor size in GM and GM/ABX mice, n = 9, pooled from three experiments, two to five animals per group. Right: Representative images of brain coronal slices, scale bar = 1 mm. (C–E) Flow cytometric analysis of NK cells in the brain and NK cell subset analysis of GM and GM/ABX mice. NK cells were gated as CD45+/CD3‐/NK1.1+ lymphocytes and divided according to CD27 and CD11b expression (C, top: GM n = 10, GM/ABX n = 10, pooled from five experiments, one to three animals per group; bottom: GM n = 7, GM/ABX n = 4 pooled from four experiments, one to three animals per group; (D) GM n = 7, GM/ABX n = 7 pooled from four experiments, one to three animals per group; (E) GM n = 5, GM/ABX n = 3 pooled from four experiments, one to two animals per group). (F, G) Percentage (GM n = 5, GM/ABX n = 6 pooled from three experiments, one to three animals per group) and absolute number (GM n = 8, GM/ABX = 12 pooled from five experiments, one to four animals per group) of NK cell subsets in the BM. (H, I) Percentage (GM n = 7, GM/ABX n = 7 pooled from four experiments, one to three animals per group) and absolute number (GM n = 5, GM/ABX n = 6 pooled from four experiments, one to two animals per group) of NK cell subsets in the spleen. (L) Flow‐cytometric analysis of NK cell activating ligands and MHC class I expression in murine GL261 cells. (M) NK cell degranulation activity against GL261 cells. (N) Activation status of CD27+CD11b+ NK cells in the tumoral hemispheres of GM and GM/ABX mice (representative experiment). (O) Upper: Study design of in vivo NK cell depletion; lower: tumor size in NK cell–depleted GM and GM/ABX mice, n = 5 per group pooled from two experiments, two to three animals per group. (P) Upper left: Flow cytometric quantification of microglia defined as CD45low/CD11b+/Ly6C–/Ly6G– population (n = 7 pooled from four experiments, one to three animals per group); upper right: brain‐associated monocytes/macrophages defined as CD45+/CD11b+/Ly6C+ (GM n = 7, GM/ABX n = 5 pooled from four experiments, one to two animals per group); lower left: NKT lymphocytes (CD45+/CD3+/NK1.1+; GM n = 7, GM/ABX n = 5 pooled from four experiments, one to two animals per group); lower right: T lymphocytes (CD45+/CD3+/NK1.1–; GM n = 7, GM/ABX n = 5 pooled from four experiments, one to two animals per group). (Q) Upper: Study design of gut microbiota recovery; lower: tumor size in GM, GM/ABX (n = 9 pooled from three experiments, two to five animals per group) and GM/R (microbiota restored mice, n = 5 pooled from two experiments, two to three animals per group). *p < 0.05, ** p <0.01, *** p <0.001 by multiple Student's t‐test or ANOVA.
