
Figure 5.
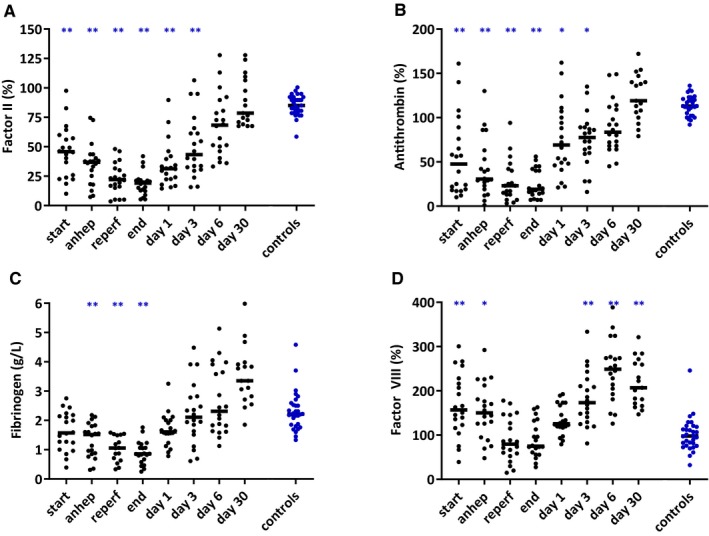
Factor II (A), antithrombin (B), fibrinogen (C), and factor VIII (D) levels at various time points in 20 pediatric patients during and after liver transplantation and 30 healthy controls. The small horizontal lines indicate medians. Factor levels are given as percentages relative to pooled normal plasma. Anhep, anhepatic phase; Reperf, reperfusion phase. *P < .05, **P < .01 compared to controls [Color figure can be viewed at http://www.wileyonlinelibrary.com]