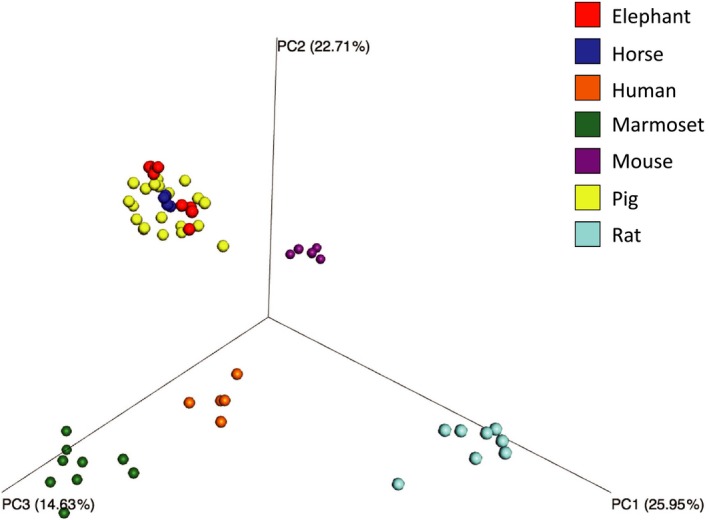
Figure 3.

Principal coordinate analysis plot of the fecal microbiota of seven monogastric animal species. Beta diversity based on weighted UniFrac distance was calculated and the plot was generated by QIIME. The PERMANNOVA calculated by QIIME2 indicated that the fecal microbiota differed significantly between animal species (p < .01)
