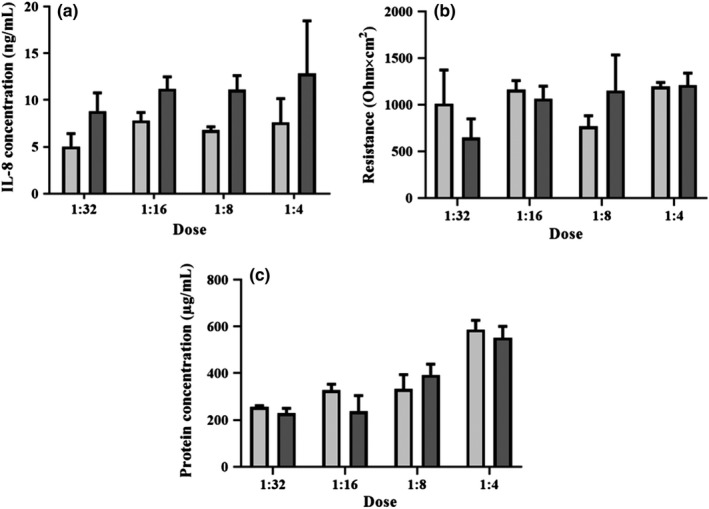
Figure 6.

(A) Chemokine IL‐8 concentration ± standard deviation (SD), (B) Resistance ± SD of the human airway construct barrier, and (C) protein concentration ± SD in apical wash, after indoor PM exposure (n = 3) (24 h) compared with control (n = 3). Controls indicated with light gray and PM exposure with dark gray. Estimated total particle mass 15 µg/cm2 (1:4), 7.4 µg/cm2 (1:8), 3.7 µg/cm2 (1:16), and 1.9 µg/cm2 (1:32)
