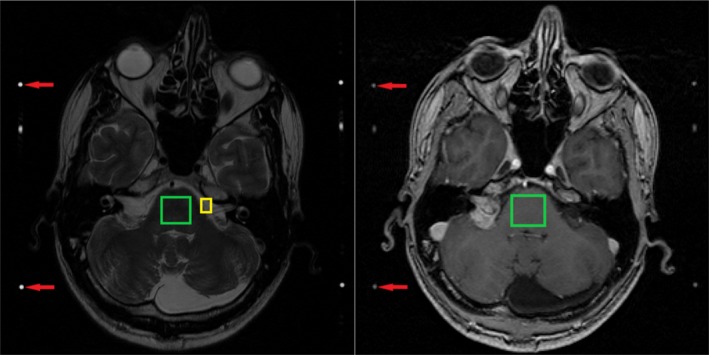
Figure 3.

Examples of the landmarks used in the multi‐landmark intensity normalization method for the T2‐weighted magnetic resonance imaging (MRI) scans (left) and T1‐weighted, contrast‐enhanced MRI scans (right). For the T1‐weighted MRI scans, the same landmarks are used as shown in the right image. Highlighted in these images are the areas for the cerebrospinal fluid (yellow), brainstem (green) and the fiducial markers (red arrows).
