Figure 3.

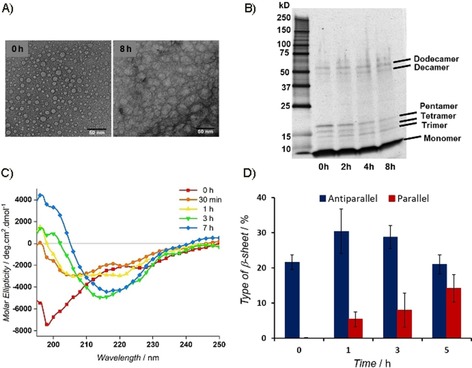
Time course of Aβ1–42 (10 μm) oligomerization in 20 mm phosphate‐buffered saline (PBS) at pH 7.4 (Protocol B). A) TEM images of Aβ1–42 at initial and final time points (8 h). B) SDS‐PAGE results showing the presence of monomeric and different small oligomeric species of Aβ1–42. C) Secondary structure of Aβ1–42 (25 μm) monitored by means of circular dichroism (CD). D) Estimated type of β‐sheet structure content, by deconvolution of CD results with the algorithm BeStSel.
