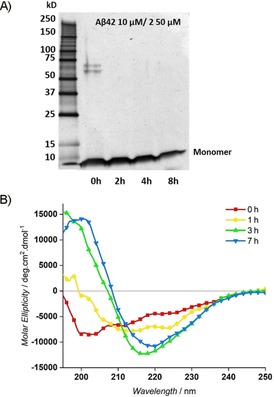
Figure 6.

The Aβ42 oligomerization pathway in the presence of compound 2 in 20 mm PBS buffer at pH 7.4. A) SDS‐PAGE and silver‐stained glycine gel, showing the Aβ42 (10 μm) oligomeric species at 0, 2, 4, and 8 h in the presence of 50 μm 2 (2/Aβ42, 5:1); B) CD time‐dependent experiment of Aβ42 (20 μm) in the presence of 100 μm 2 (2/Aβ42, 5:1). Deconvolution was performed on the results of CD measurements, after subtraction of the corresponding buffer or the solution containing a 5:1 concentration of inhibitor.
