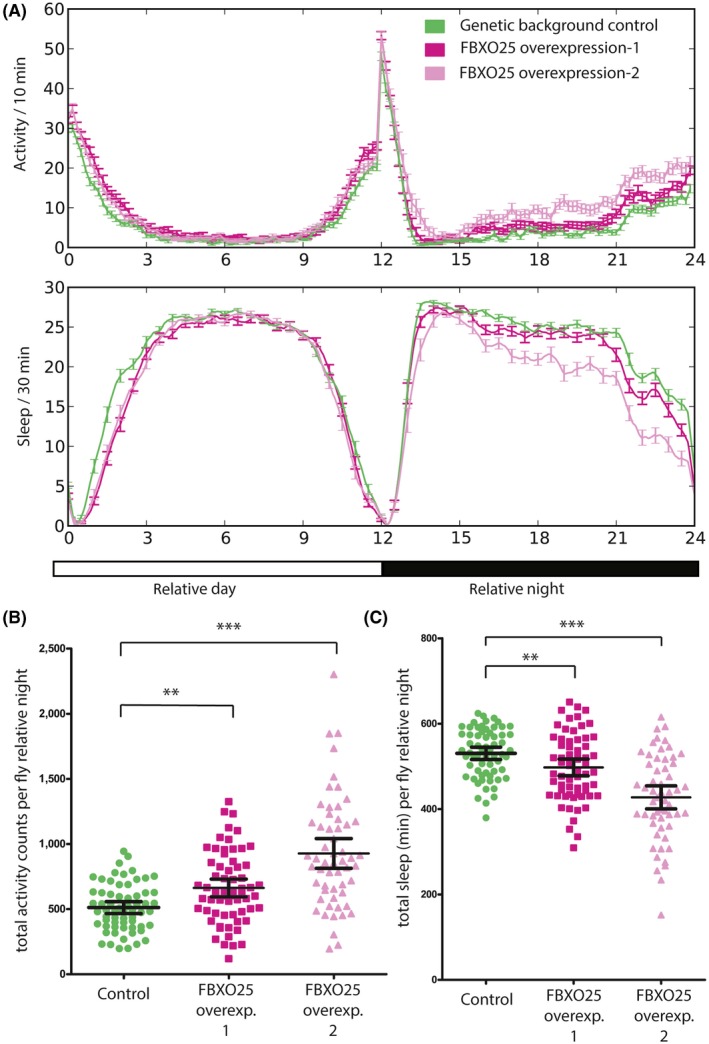
Figure 3.

Activity monitoring upon pan‐neuronal overexpression of the FBXO25 orthologue in Drosophila melanogaster. (A) Activity and sleep profiles reveal increased activity (top graph) and decreased sleep (bottom graph) in the relative night (12–24 hr). (B) Quantification of the activity counts (amount of infrared detection beam passes) of individual flies in FBXO25 overexpression–1 (n = 64) and overexpression–2 (n = 56) lines shows that the activity in the relative night is significantly and consistently higher in both compared with control (n = 63) flies (FBXO25 overexpression–1: p = .0013; FBXO25 overexpression‐2: p < .0001). (C) Quantification of sleep in minutes of single flies shows that both FBXO25 overexpression lines sleep significantly less in the relative night compared with control flies (FBXO25 overexpression–1: p = .0076; FBXO25 overexpression‐2: p < .0001). **p < .001, ***p < .0001
