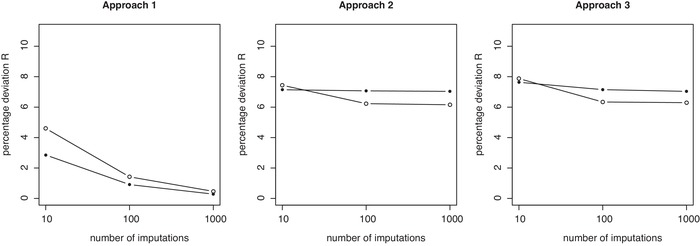
Figure 6.

Percentage deviations of predictions R across replicate calibrations for Approaches 1, 2, and 3 in the CLL data example, plotted versus the number of imputations used (, 100, 1000). Results are shown separately for fully observed records (solid dots) and observations containing missing observations (open dots), but always based on models calibrated on the full data. R measures at are 9.6% for fully observed records and 15.3% for missing observations and identical across approaches (hence not shown in above plots)
