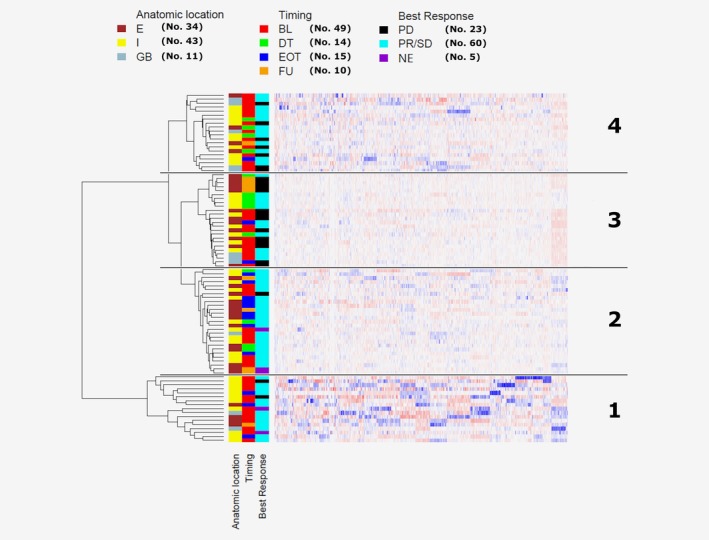
Figure 4.

Clustering analysis of single‐CTCs’ CNA profiles. Hierarchical clustering analysis of 88 single CTCs (from 23 patients) using Euclidean distance and Ward linkage method. Reference bars on the top of the dendrogram indicate anatomic location (intrahepatic, I; entrahepatic, E; gallbladder, GB), blood draw timing (baseline, BL; during treatment, DT; end of treatment, EOT; follow‐up, FU) and treatment‐line best response (disease progression, PD; partial response/stable disease, PR/SD; not evaluable, NE). Numbers in brackets refer to the total number of CTCs within each category. The four main clusters are identified by numbers 1–4 (right side). [Color figure can be viewed at http://wileyonlinelibrary.com]
