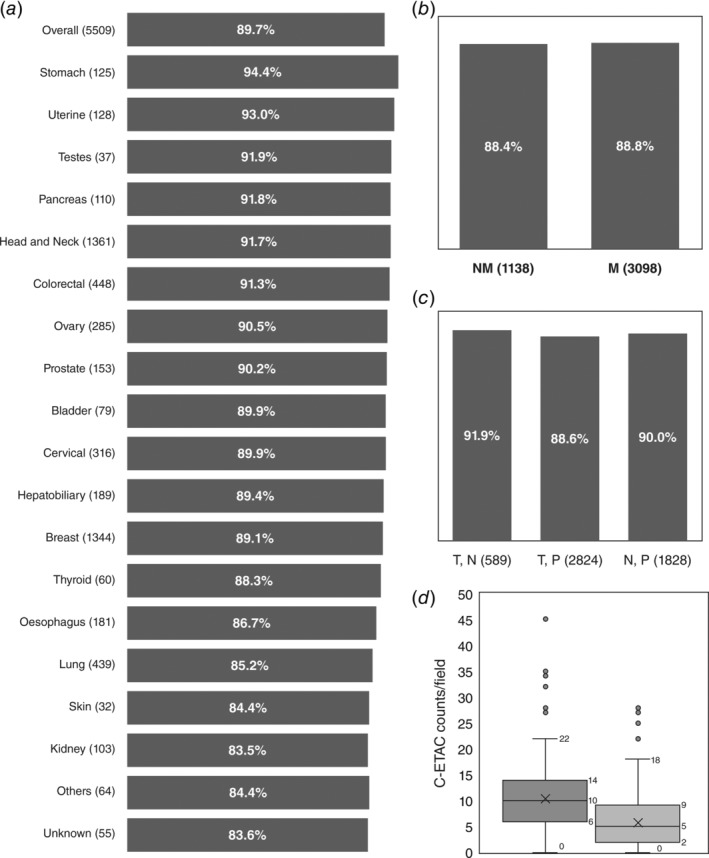
Figure 5.

Ubiquity of C‐ETACs. (a) C‐ETACs were evaluated in 5,509 previously diagnosed cases of cancers. Dark bars represent percentage of total samples in each cancer type (and overall) where C‐ETACs could be detected. (b) C‐ETACs were detected with comparable frequency in metastatic (M) as well as nonmetastatic (NM) cancer samples (UA: metastatic status unavailable). (c) C‐ETACs detection was irrespective of treatment and radiological status. T, N: treated with presently no radiological evidence of disease; T, P: treated with radiologically evident disease; N, P: therapy naïve with radiologically evident disease. (d) C‐ETAC counts in presurgery (dark bar) and postsurgery (light bar) sample.
