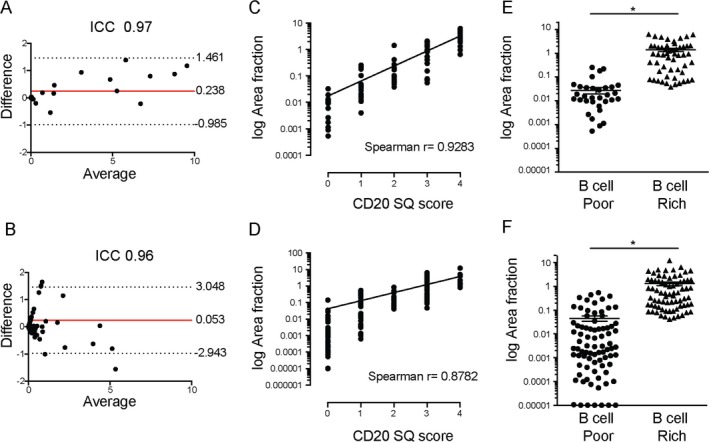
Figure 2.

Semiquantitative (SQ) B cell scores and digital image analysis. A and B, Bland‐Altman plots showing the difference between and average of 2 measurements of CD20+ B cell area fraction (percent of stained area, calculated as total stained area/total tissue area × 100) in the cohort of patients with early rheumatoid arthritis (RA; n = 15) (A) and in the cohort of patients with established RA with an inadequate response to tumor necrosis factor inhibitors (TNFi‐IR; n = 100) (B), obtained by 2 independent observers in 2 different centers (Queen Mary University of London and University of Pavia). Solid lines indicate the mean; dotted lines indicate the 95% confidence interval. ICC = intraclass correlation coefficient. C and D, Correlation between semiquantitative CD20+ B cell score and CD20+ B cell area fraction in the early RA cohort (n = 91) (C) and the TNFi‐IR cohort (n = 155) (D). E and F, CD20+ B cell area fraction in the early RA cohort (n = 91) (E) and the TNFi‐IR cohort (n = 155) (F) classified as B cell poor or B cell rich. Symbols represent individual patients; horizontal lines and error bars show the mean ± SD. * = P < 0.05 by Mann‐Whitney test. Color figure can be viewed in the online issue, which is available at http://onlinelibrary.wiley.com/doi/10.1002/art.41184/abstract.
