Figure 3.

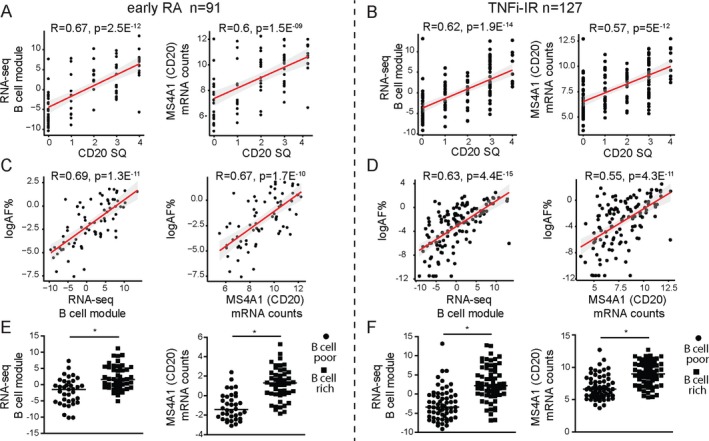
Correlation of semiquantitative (SQ) B cell scores with RNA‐Seq B cell module scores. A and B, Correlations between the semiquantitative CD20+ B cell score and the RNA‐Seq B cell module and between the semiquantitative CD20+ B cell score and CD20/MS4A1 gene expression levels in the cohort of patients with early rheumatoid arthritis (RA) (A) and the cohort of patients with established RA with an inadequate response to tumor necrosis factor inhibitors (TNFi‐IR) (B). C and D, Correlations between the CD20+ B cell area fraction (AF) (percent of stained area, calculated as total stained area/total tissue area × 100) and the RNA‐Seq B cell module and between the CD20+ B cell area fraction and CD20/MS4A1 gene expression levels in the early RA cohort (C) and the TNFi‐IR cohort (D). In A–D, symbols represent individual patients (n = 91 for early RA and 127 for TNFi‐IR); Lines and shading indicate the regression line and 95% confidence interval. E and F, RNA‐Seq B cell module and CD20/MS4A1 gene expression levels in B cell–poor and B cell–rich patients in the early RA cohort (n = 91) (E) and TNFi‐IR cohort (n = 127) (F). Symbols represent individual patients; horizontal lines show the mean. * = P < 0.05 by Mann‐Whitney test. Color figure can be viewed in the online issue, which is available at http://onlinelibrary.wiley.com/doi/10.1002/art.41184/abstract.
