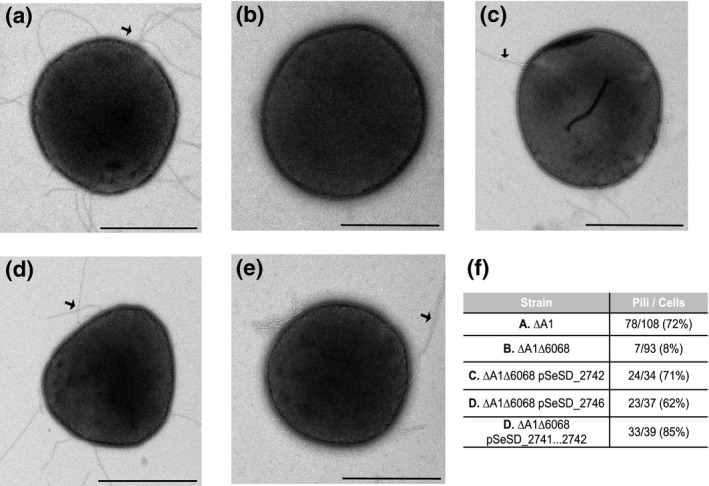
Figure 3.

Genes within the deleted region encode pilins. Electron microscopy showing negative stained, whole cells of (a) SSV9‐susceptible parental strain, ∆A1 (b) Derived resistant, ∆A1∆6068. (c) ∆A1∆6068 pSeSD_2741…2746, (d) ∆A1∆6068 pSeSD_2742, (e) ∆A1∆6068 pSeSD_2746 and (f) Results of a double‐blind experiment in each strain where the number of cells containing pili observed over the total number of cells observed are reported. Scale bars are 1 µm. Black arrows indicate the examples of pilin structures
